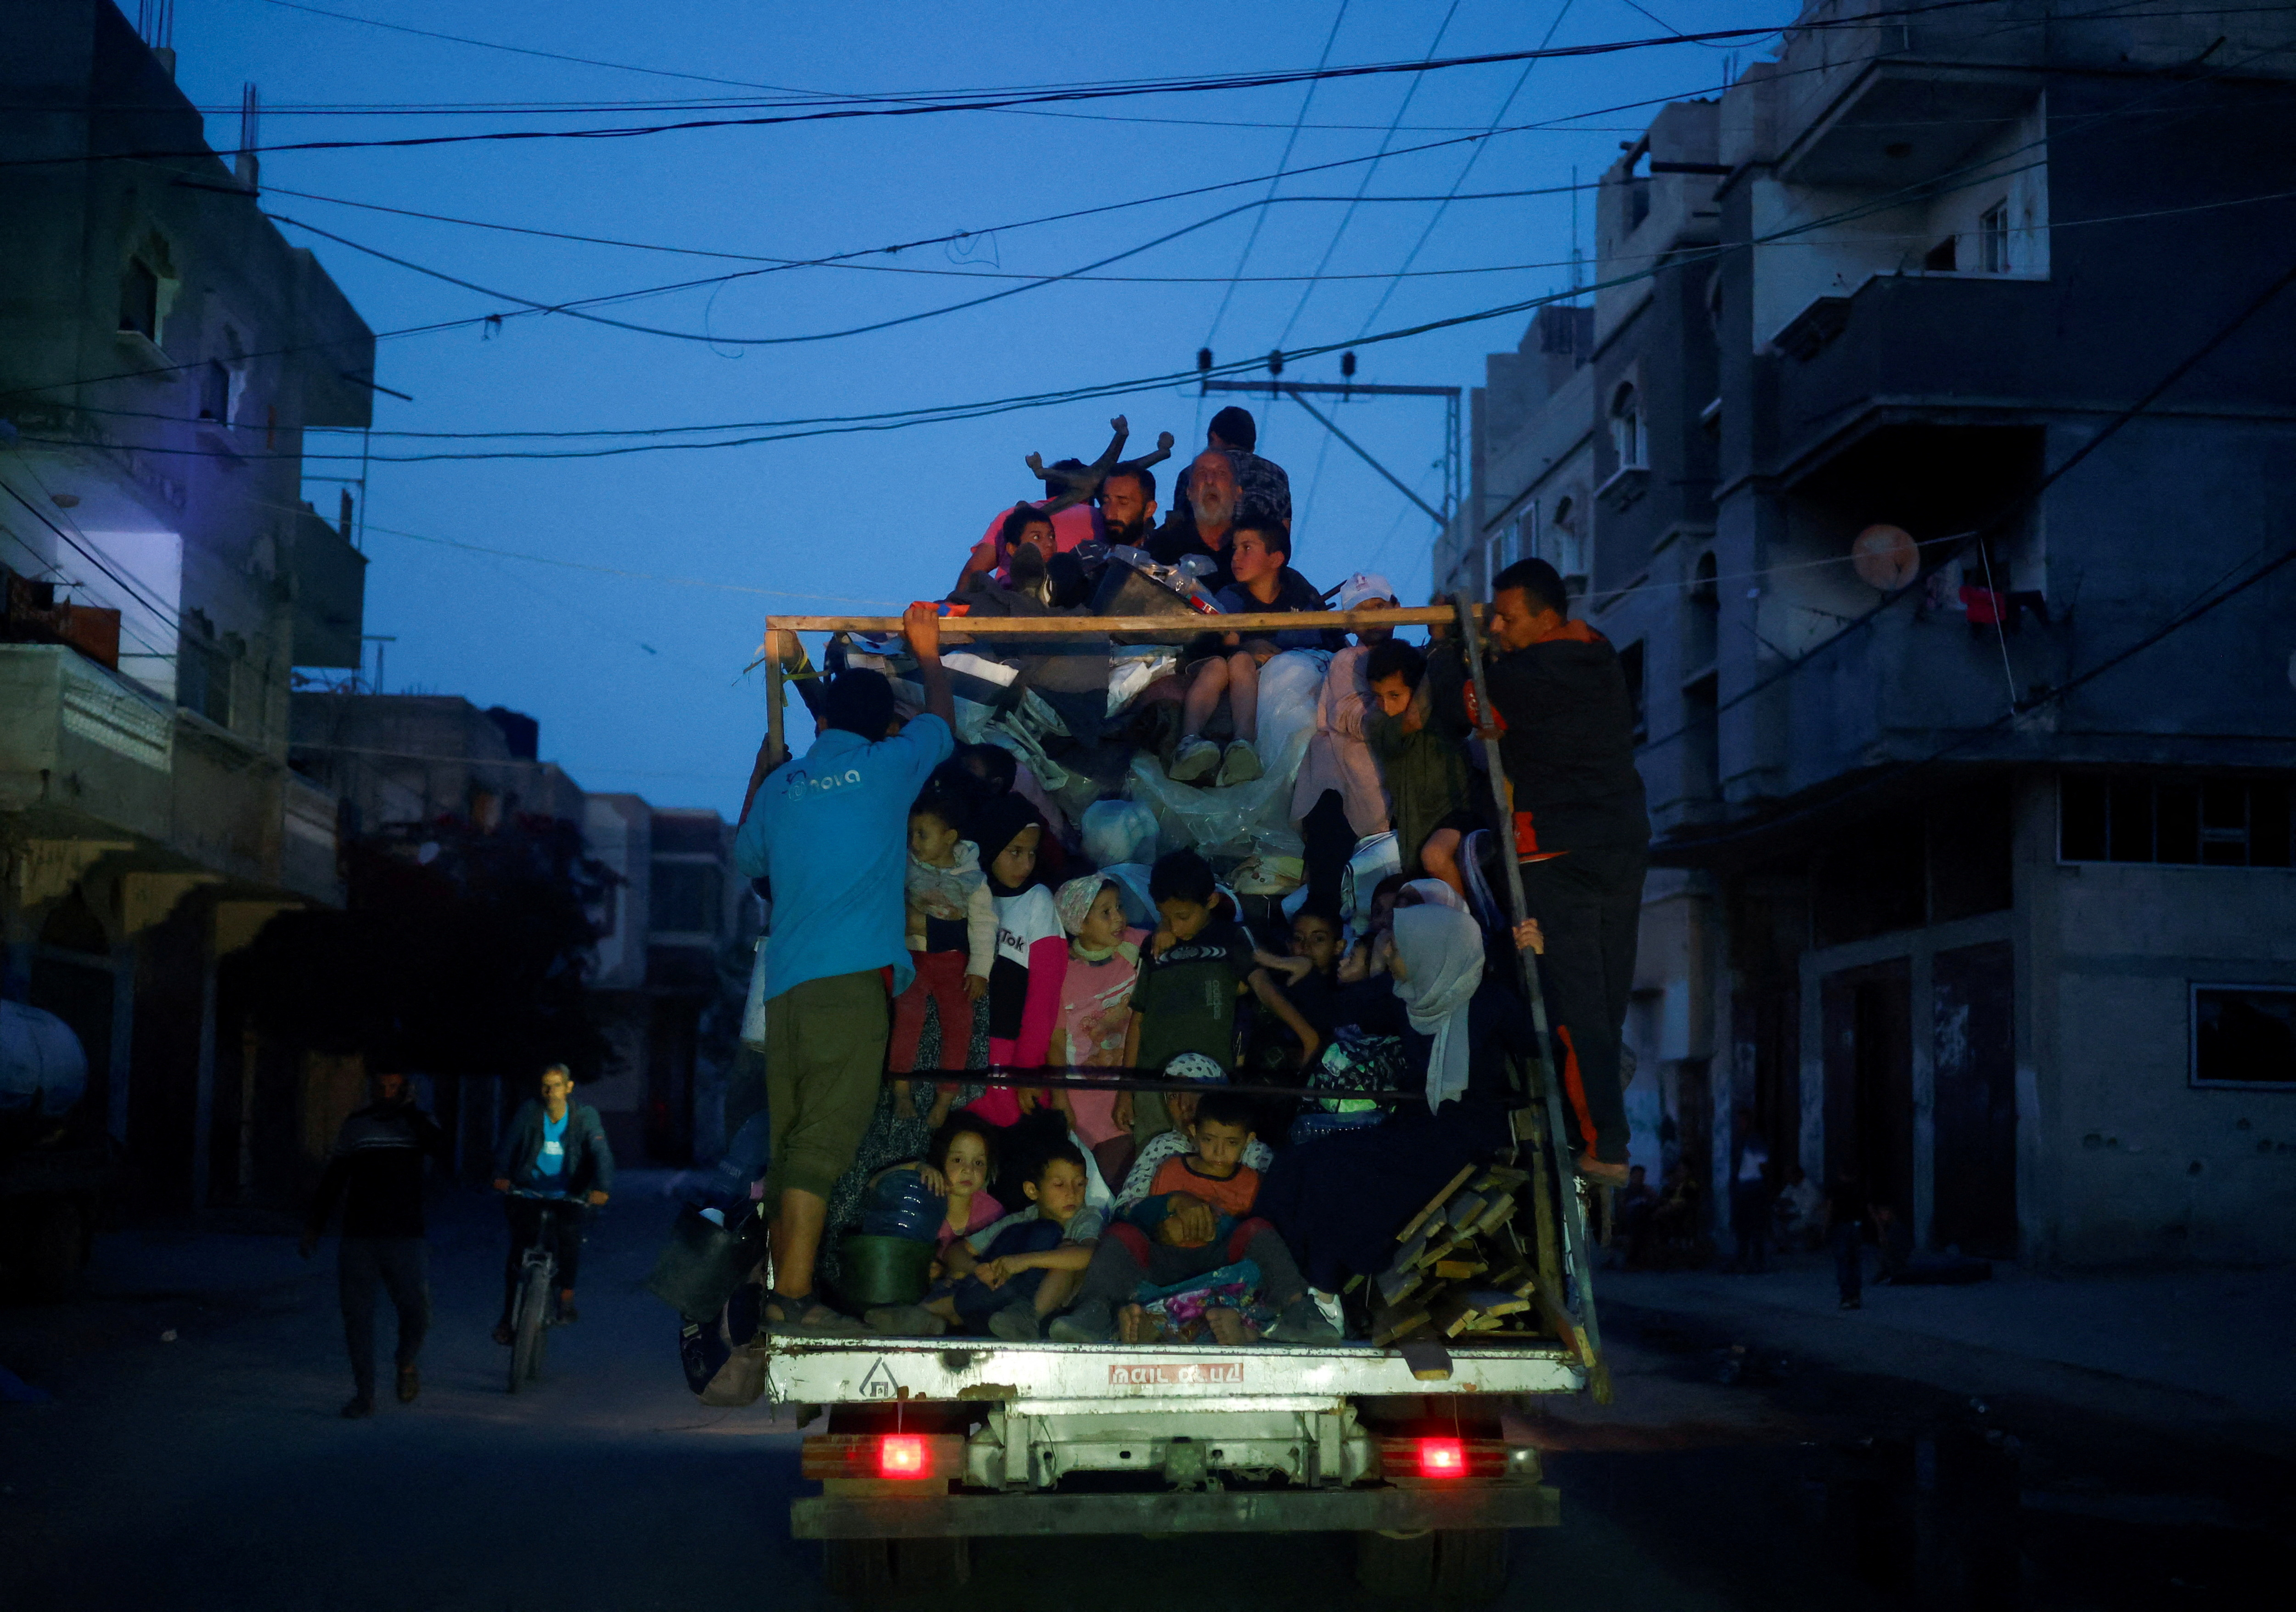
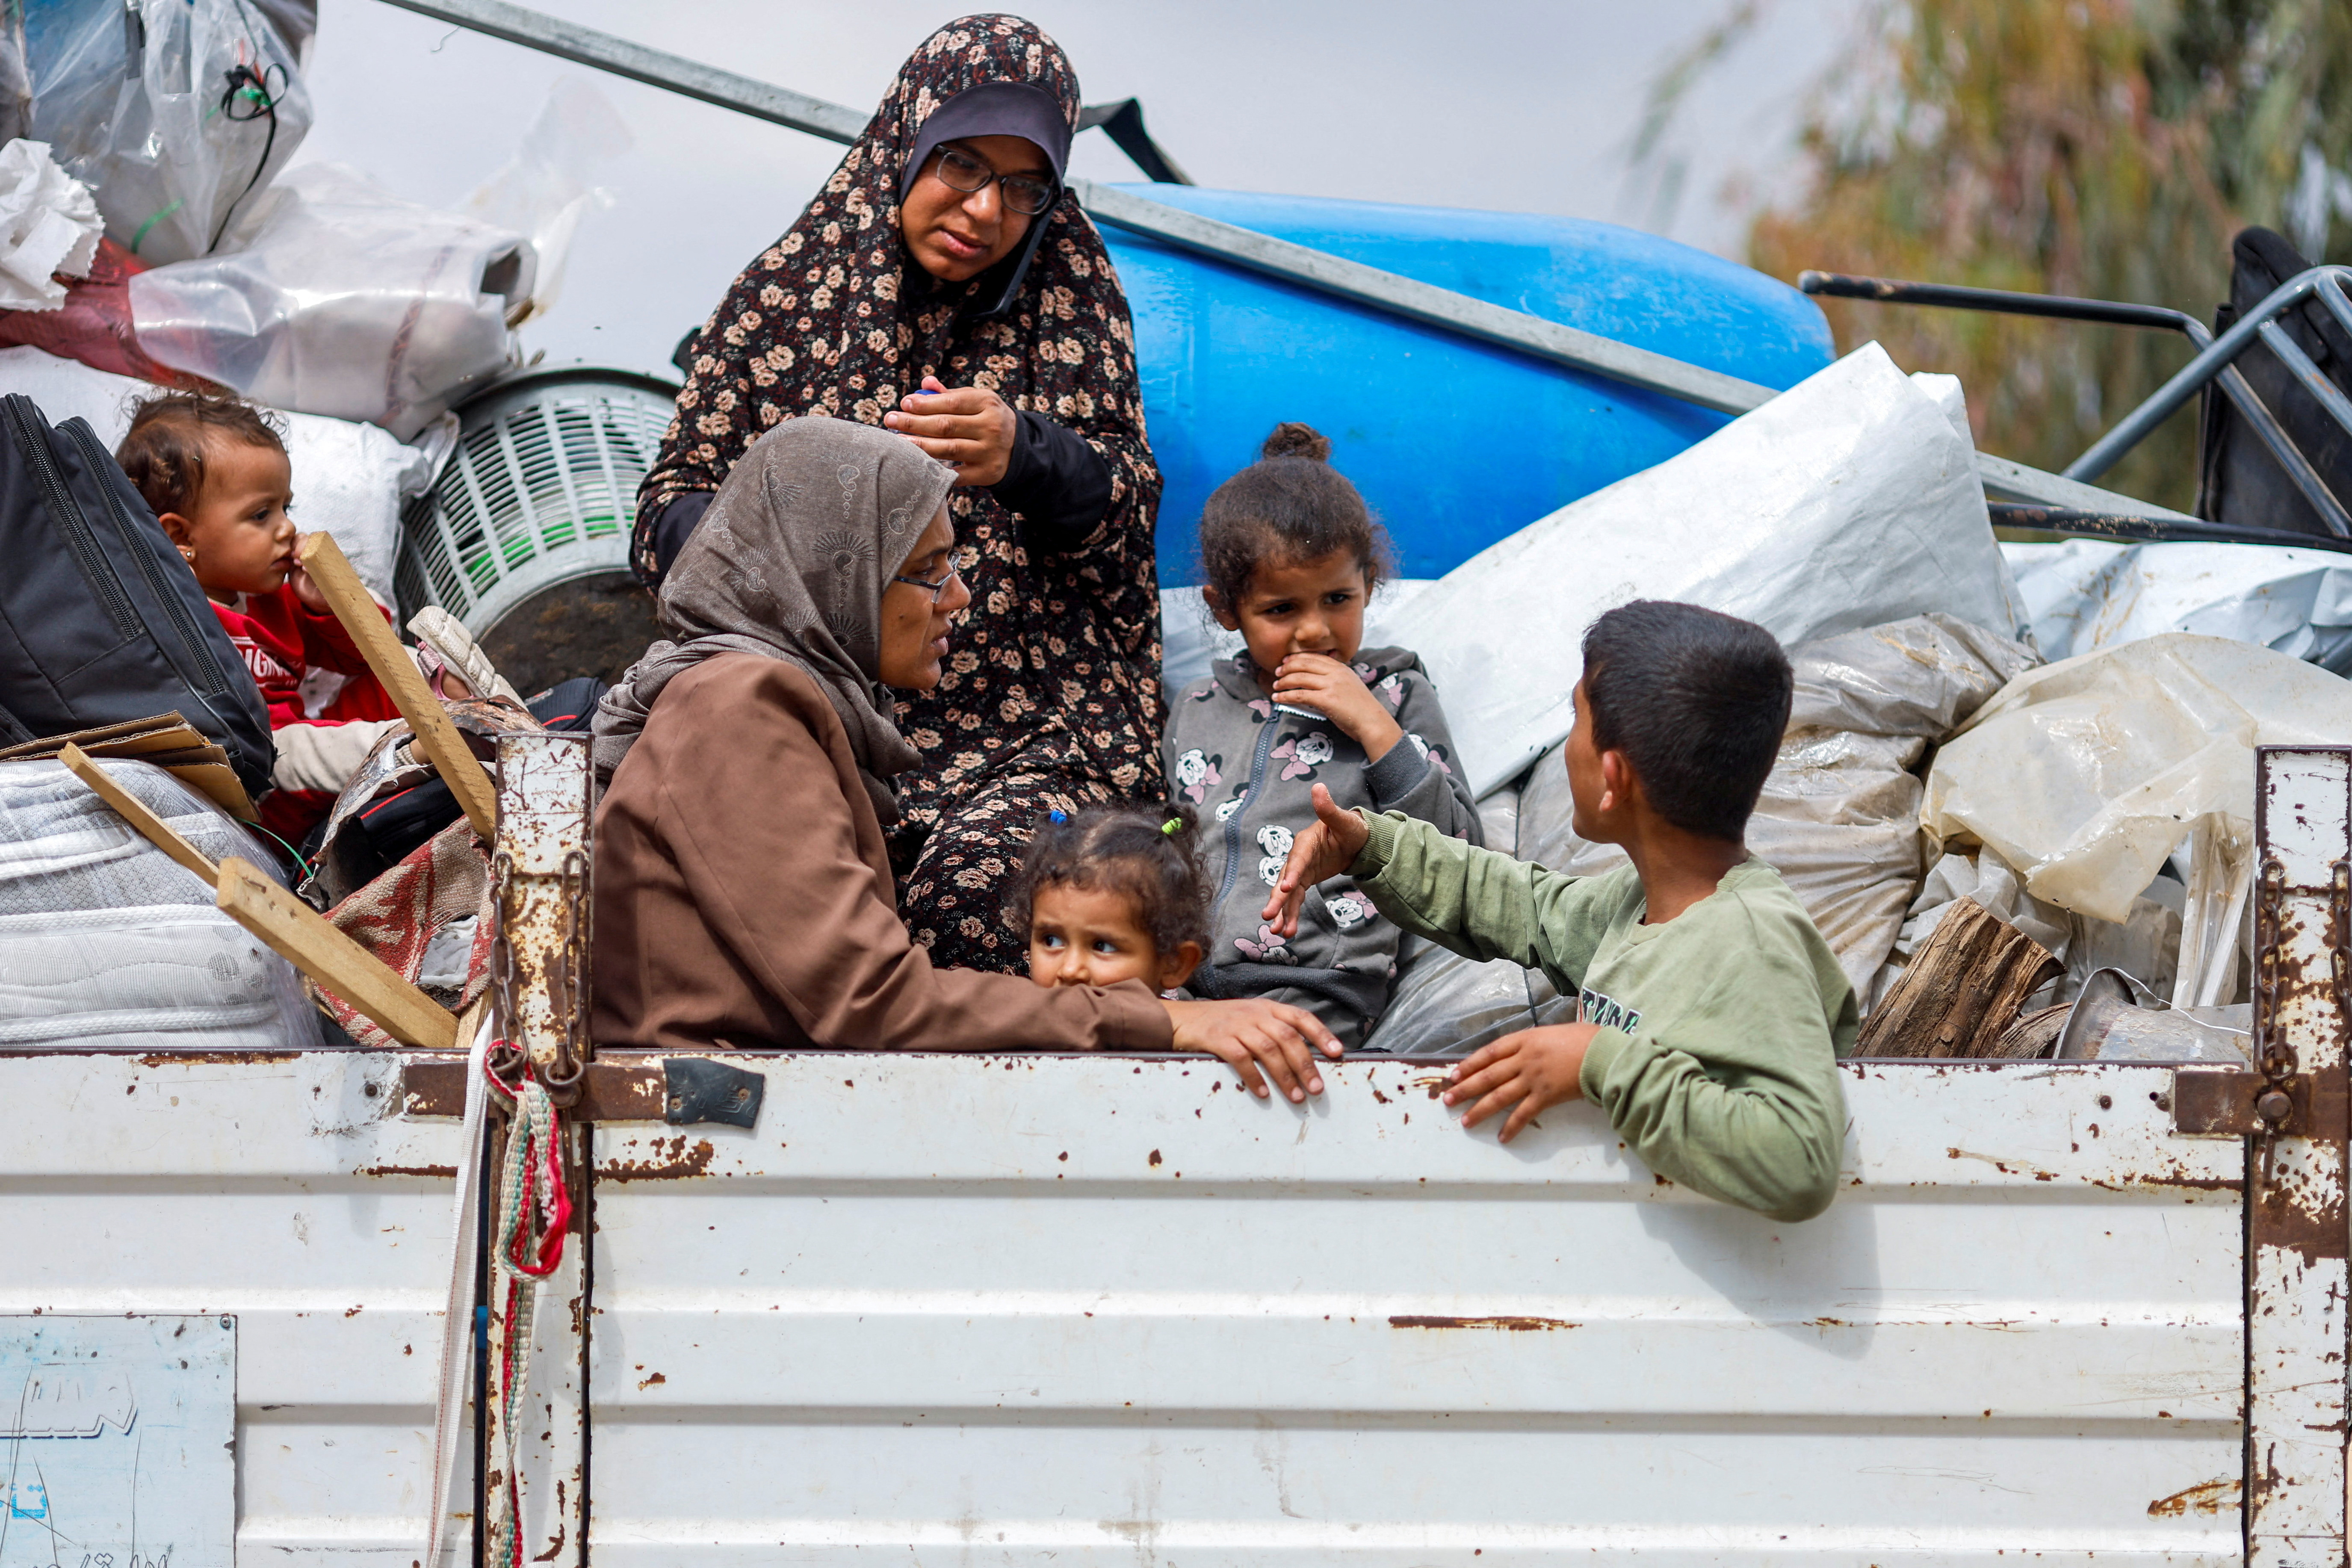
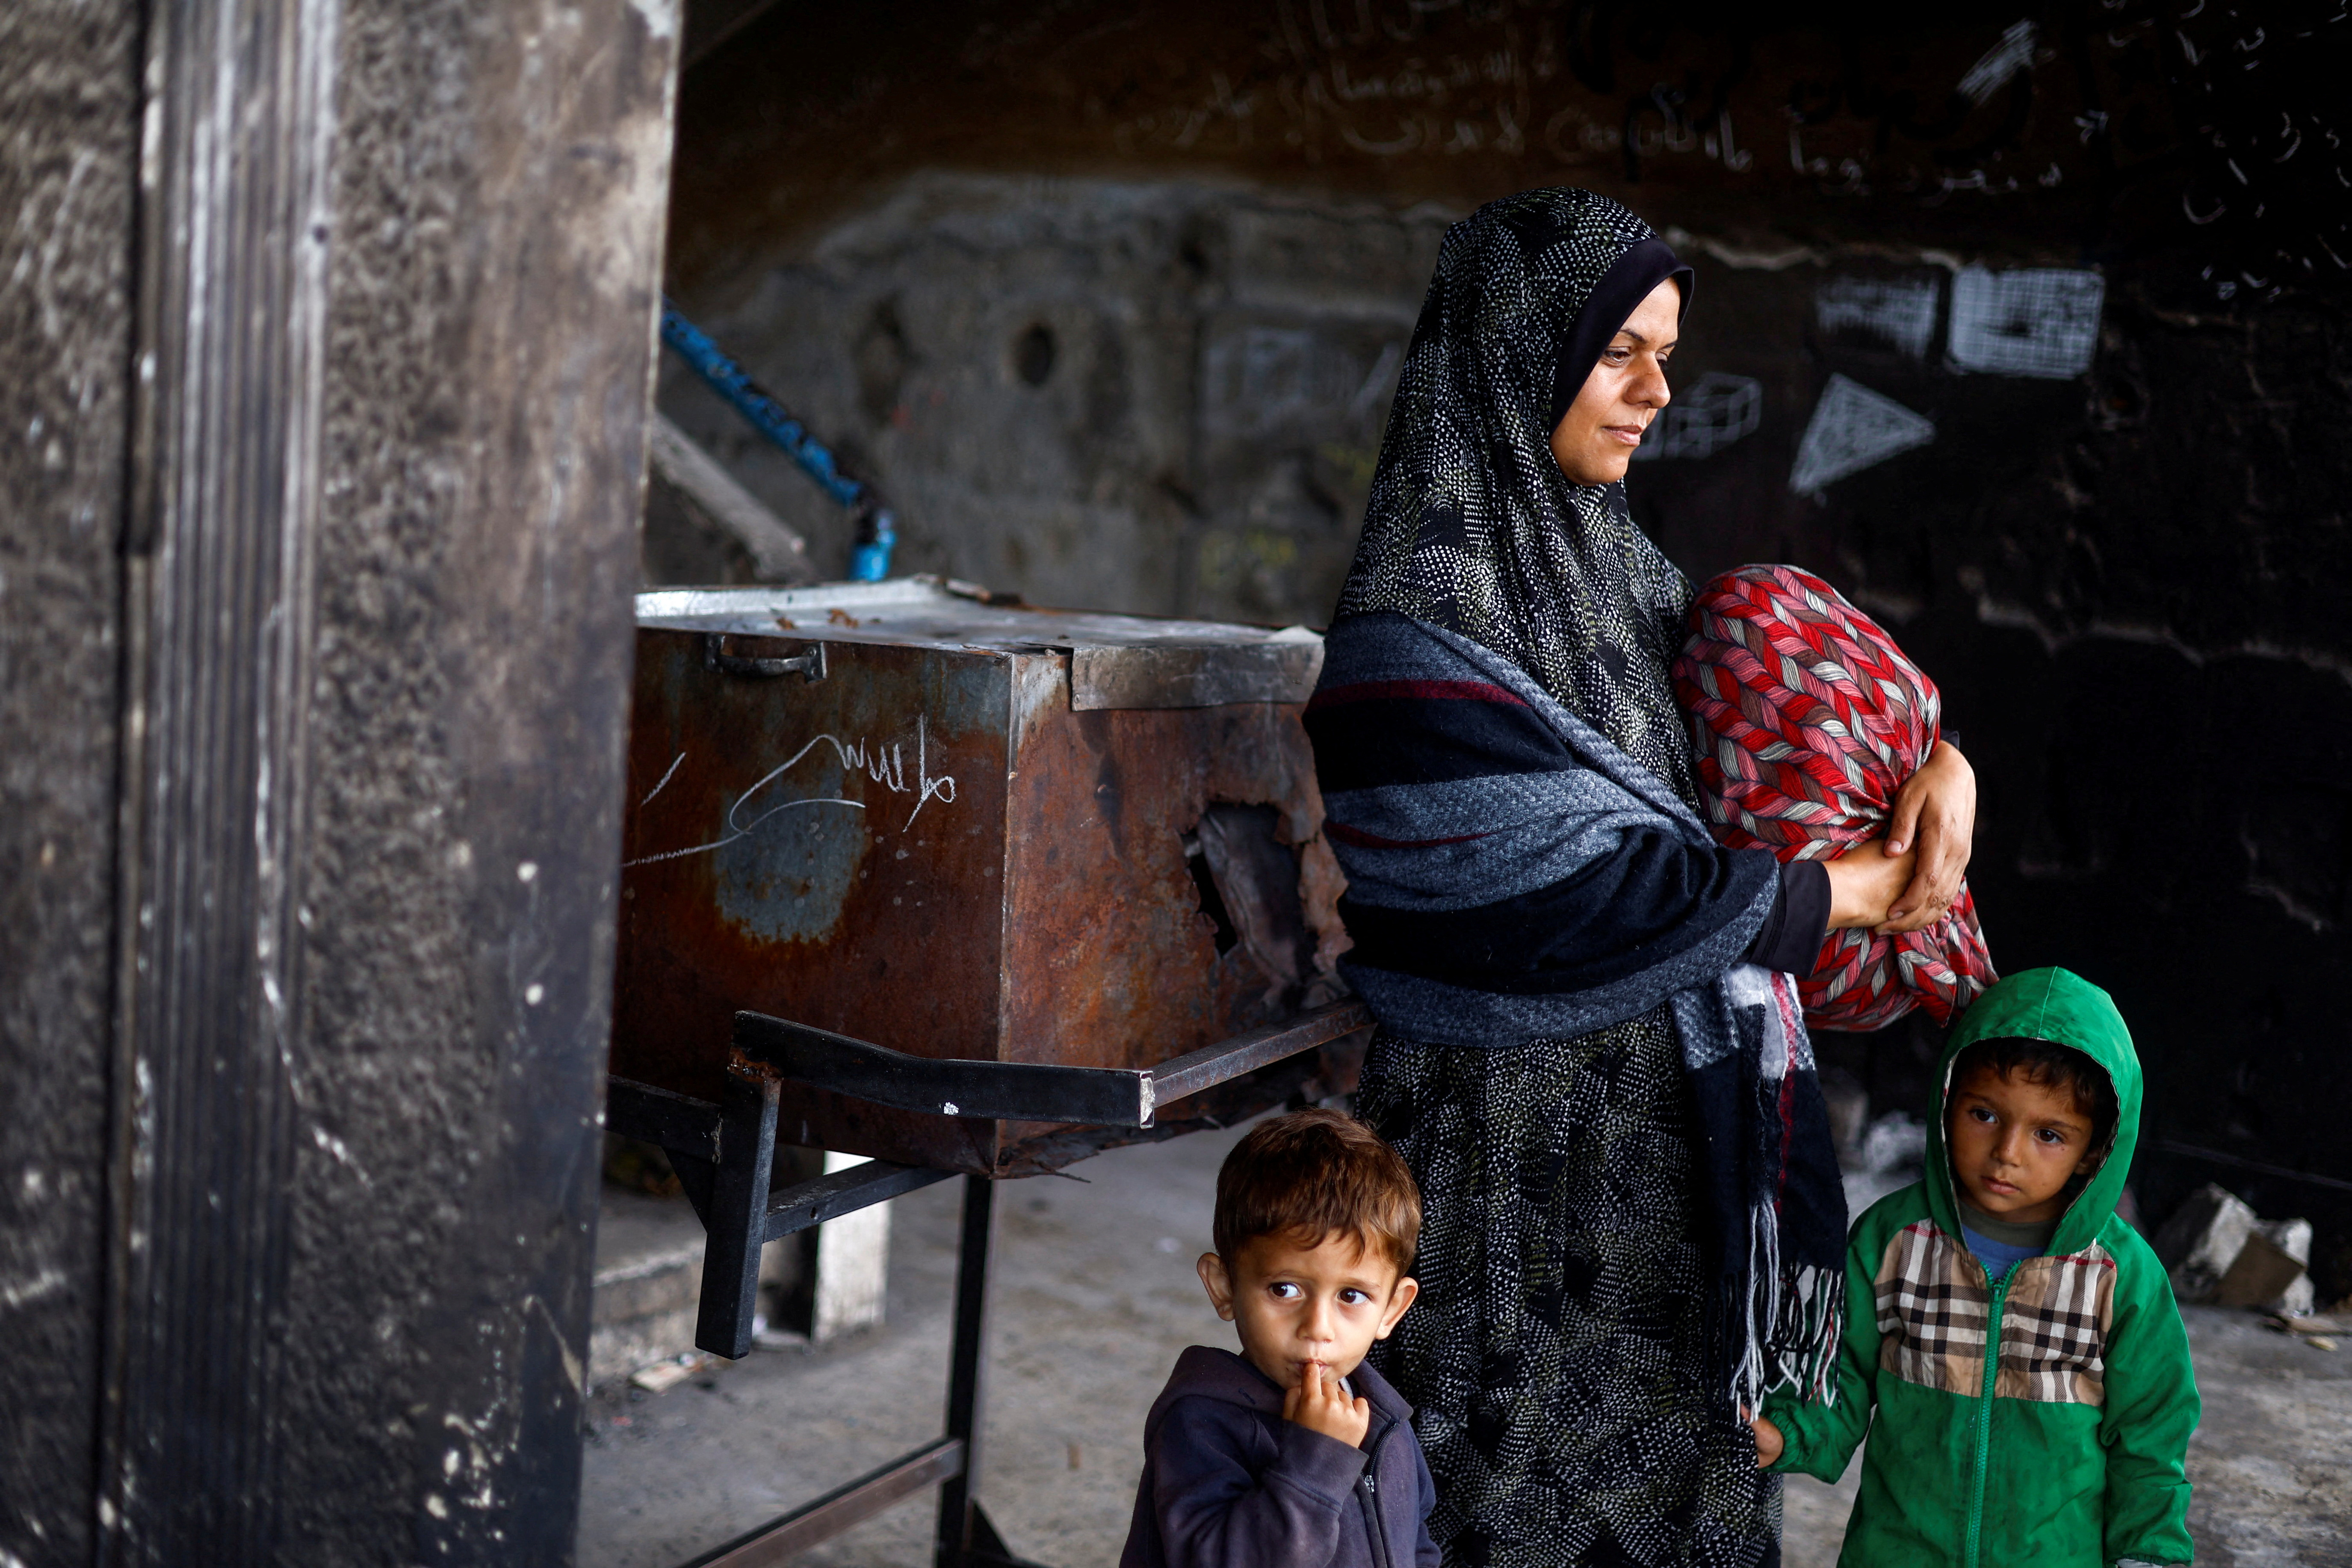
Semitec Corp (6626.T)
6626.T on Tokyo Stock Exchange
5,200JPY
20 Apr 2018
5,200JPY
20 Apr 2018
Change (% chg)
¥30 (+0.58%)
¥30 (+0.58%)
Prev Close
¥5,170
¥5,170
Open
¥5,100
¥5,100
Day's High
¥5,270
¥5,270
Day's Low
¥5,100
¥5,100
Volume
3,500
3,500
Avg. Vol
65,721
65,721
52-wk High
¥11,360
¥11,360
52-wk Low
¥1,640
¥1,640
Revenue & Earnings Per Share
Revenue* | Earnings Per Share** | ||
---|---|---|---|
FY 2018 | Dec | 3,673.32 | 57.228 |
Sep | 3,617.91 | 82.244 | |
Jun | 3,598.55 | 24.838 | |
FY 2017 | Mar '17 | 3,311.77 | -0.043 |
Dec | 3,295.56 | 125.090 | |
Sep | 3,292.55 | 41.332 | |
Jun | 3,232.94 | -26.226 | |
FY 2016 | Mar '16 | 3,145.75 | -16.218 |
Dec | 3,205.95 | 37.817 | |
Sep | 3,431.28 | 56.259 | |
Jun | 3,404.94 | 38.700 |
*Note: Units in Millions ofYen
**Note: Units in Yen
Consensus Estimates Analysis
# of Estimates | Mean | High | Low | 1 Year Ago |
---|
Sales and Profit Figures in US Dollar (USD);
Valuation Ratios
Company | industry | sector | ||
---|---|---|---|---|
P/E Ratio (TTM) | 23.98 | 28.50 | 24.65 | |
P/E High - Last 5 Yrs. | 16.12 | 57.27 | 42.15 | |
P/E Low - Last 5 Yrs. | 7.52 | 18.37 | 14.03 | |
Beta | 1.00 | 1.06 | 0.96 | |
Price to Sales (TTM) | 0.96 | 5.21 | 53.35 | |
Price to Book (MRQ) | 1.68 | 3.62 | 2.69 | |
Price to Tangible Book (MRQ) | 1.70 | 4.48 | 4.41 | |
Price to Cash Flow (TTM) | 13.88 | 20.97 | 16.87 | |
% Owned Institutions | -- | 0.58 | 1.89 |
Dividends
Company | industry | sector | ||
---|---|---|---|---|
Dividend Yield | 0.44 | 0.96 | 1.46 | |
Dividend Yield - 5 Year Avg | 1.04 | 1.06 | 1.55 | |
Dividend 5 Year Growth Rate | 0.00 | 13.78 | 6.87 | |
Payout Ratio(TTM) | 10.46 | 22.01 | 29.42 |
Growth Rates
Company | industry | sector | ||
---|---|---|---|---|
Sales (MRQ) vs Qtr. 1 Yr. Ago | 11.31 | 14.13 | 35.19 | |
Sales (TTM) vs TTM 1 Yr. Ago | 3.71 | 5.02 | 76.37 | |
Sales - 5 Yr. Growth Rate | 7.04 | 7.46 | 8.08 | |
EPS (MRQ) vs Qtr. 1 Yr. Ago | 194.71 | 51.42 | 111.72 | |
EPS (TTM) vs TTM 1 Yr. Ago | 270.34 | -- | -- | |
EPS - 5 Yr. Growth Rate | -- | 17.45 | 12.22 | |
Capital Spending - 5 Yr. Growth Rate | 7.05 | 8.64 | 8.01 |
Financial Strength
Company | industry | sector | |
---|---|---|---|
Quick Ratio (MRQ) | 1.64 | 4.41 | 1.90 |
Current Ratio (MRQ) | 2.27 | 5.10 | 2.29 |
LT Debt to Equity (MRQ) | 6.36 | 14.52 | 74.58 |
Total Debt to Equity (MRQ) | 30.13 | 23.93 | 96.71 |
Interest Coverage (TTM) | 2.68 | 25.43 | 62.46 |
Profitability Ratios
Company | industry | sector | ||
---|---|---|---|---|
Gross Margin (TTM) | 32.11 | 41.57 | 30.51 | |
Gross Margin - 5 Yr. Avg. | 28.66 | 25.05 | 30.03 | |
EBITD Margin (TTM) | 9.06 | -- | -- | |
EBITD - 5 Yr. Avg | 7.16 | 13.20 | 19.70 | |
Operating Margin (TTM) | 4.98 | 19.40 | 14.77 | |
Operating Margin - 5 Yr. Avg. | 2.55 | 8.62 | 14.58 | |
Pre-Tax Margin (TTM) | 6.79 | 19.91 | 13.37 | |
Pre-Tax Margin - 5 Yr. Avg. | 3.91 | 8.99 | 12.28 | |
Net Profit Margin (TTM) | 4.01 | 14.24 | 9.56 | |
Net Profit Margin - 5 Yr. Avg. | 1.86 | 6.43 | 8.64 | |
Effective Tax Rate (TTM) | 40.90 | 25.96 | 27.39 | |
Effective Tax Rate - 5 Yr. Avg. | 52.51 | 23.19 | 29.25 |
Efficiency
Company | industry | sector | ||
---|---|---|---|---|
Revenue/Employee (TTM) | 4,327,807 | 32,040,642 | 657,034,690 | |
Net Income/Employee (TTM) | 173,580 | 7,222,295 | 54,816,329 | |
Receivable Turnover (TTM) | 4.20 | 4.79 | 5.69 | |
Inventory Turnover (TTM) | 3.37 | 3.91 | 74.00 | |
Asset Turnover (TTM) | 1.10 | 0.74 | 0.65 |
Management Effectiveness
Company | industry | sector | ||
---|---|---|---|---|
Return on Assets (TTM) | 4.42 | 8.62 | 5.17 | |
Return on Assets - 5 Yr. Avg. | 1.93 | 5.36 | 4.42 | |
Return on Investment (TTM) | 6.47 | 10.72 | 7.25 | |
Return on Investment - 5 Yr. Avg. | 2.81 | 7.25 | 6.32 | |
Return on Equity (TTM) | 7.46 | 12.88 | 12.43 | |
Return on Equity - 5 Yr. Avg. | 3.32 | 9.17 | 11.13 |
1 Year | 3 Year | 5 Year | |
---|---|---|---|
Sales % | -0.42 | 3.26 | 7.04 |
EPS (TTM) % | 20.19 | 7.56 | -- |
Dividend % | 0.00 | 0.00 | 0.00 |
Note: Units in Millions of US Dollars
Performance for Semitec Corp
Period | % Actual |
% vs. S&P 500 |
Rank In Industry |
Industry Rank |
---|---|---|---|---|
4 Week | 9.17 | 3.11 | 69 | 80 |
13 Week | 58.10 | 50.60 | 93 | 90 |
26 Week | 158.16 | 127.96 | 97 | 88 |
52 Week | 282.72 | 207.13 | 96 | 85 |
YTD | 216.21 | 184.62 | 96 | 74 |
Note:: Rank is a percentile that ranges from 0 to 99, with 99 = best.
Institutional Holders
% Shares Owned: | 3.59% |
# of Holders: | 4 |
Total Shares Held: | 101,805 |
3 Mo. Net Change: | 0 |
# New Positions: | 0 |
# Closed Positions: | 0 |
# Increased Positions: | 0 |
# Reduced Positions: | 0 |
# Net Buyers: | 0 |
NYSE and AMEX quotes delayed by at least 20 minutes. NASDAQ delayed by at least 15 minutes. For a complete list of exchanges and delays, please click here.