China launches 'punishment' war games around Taiwan
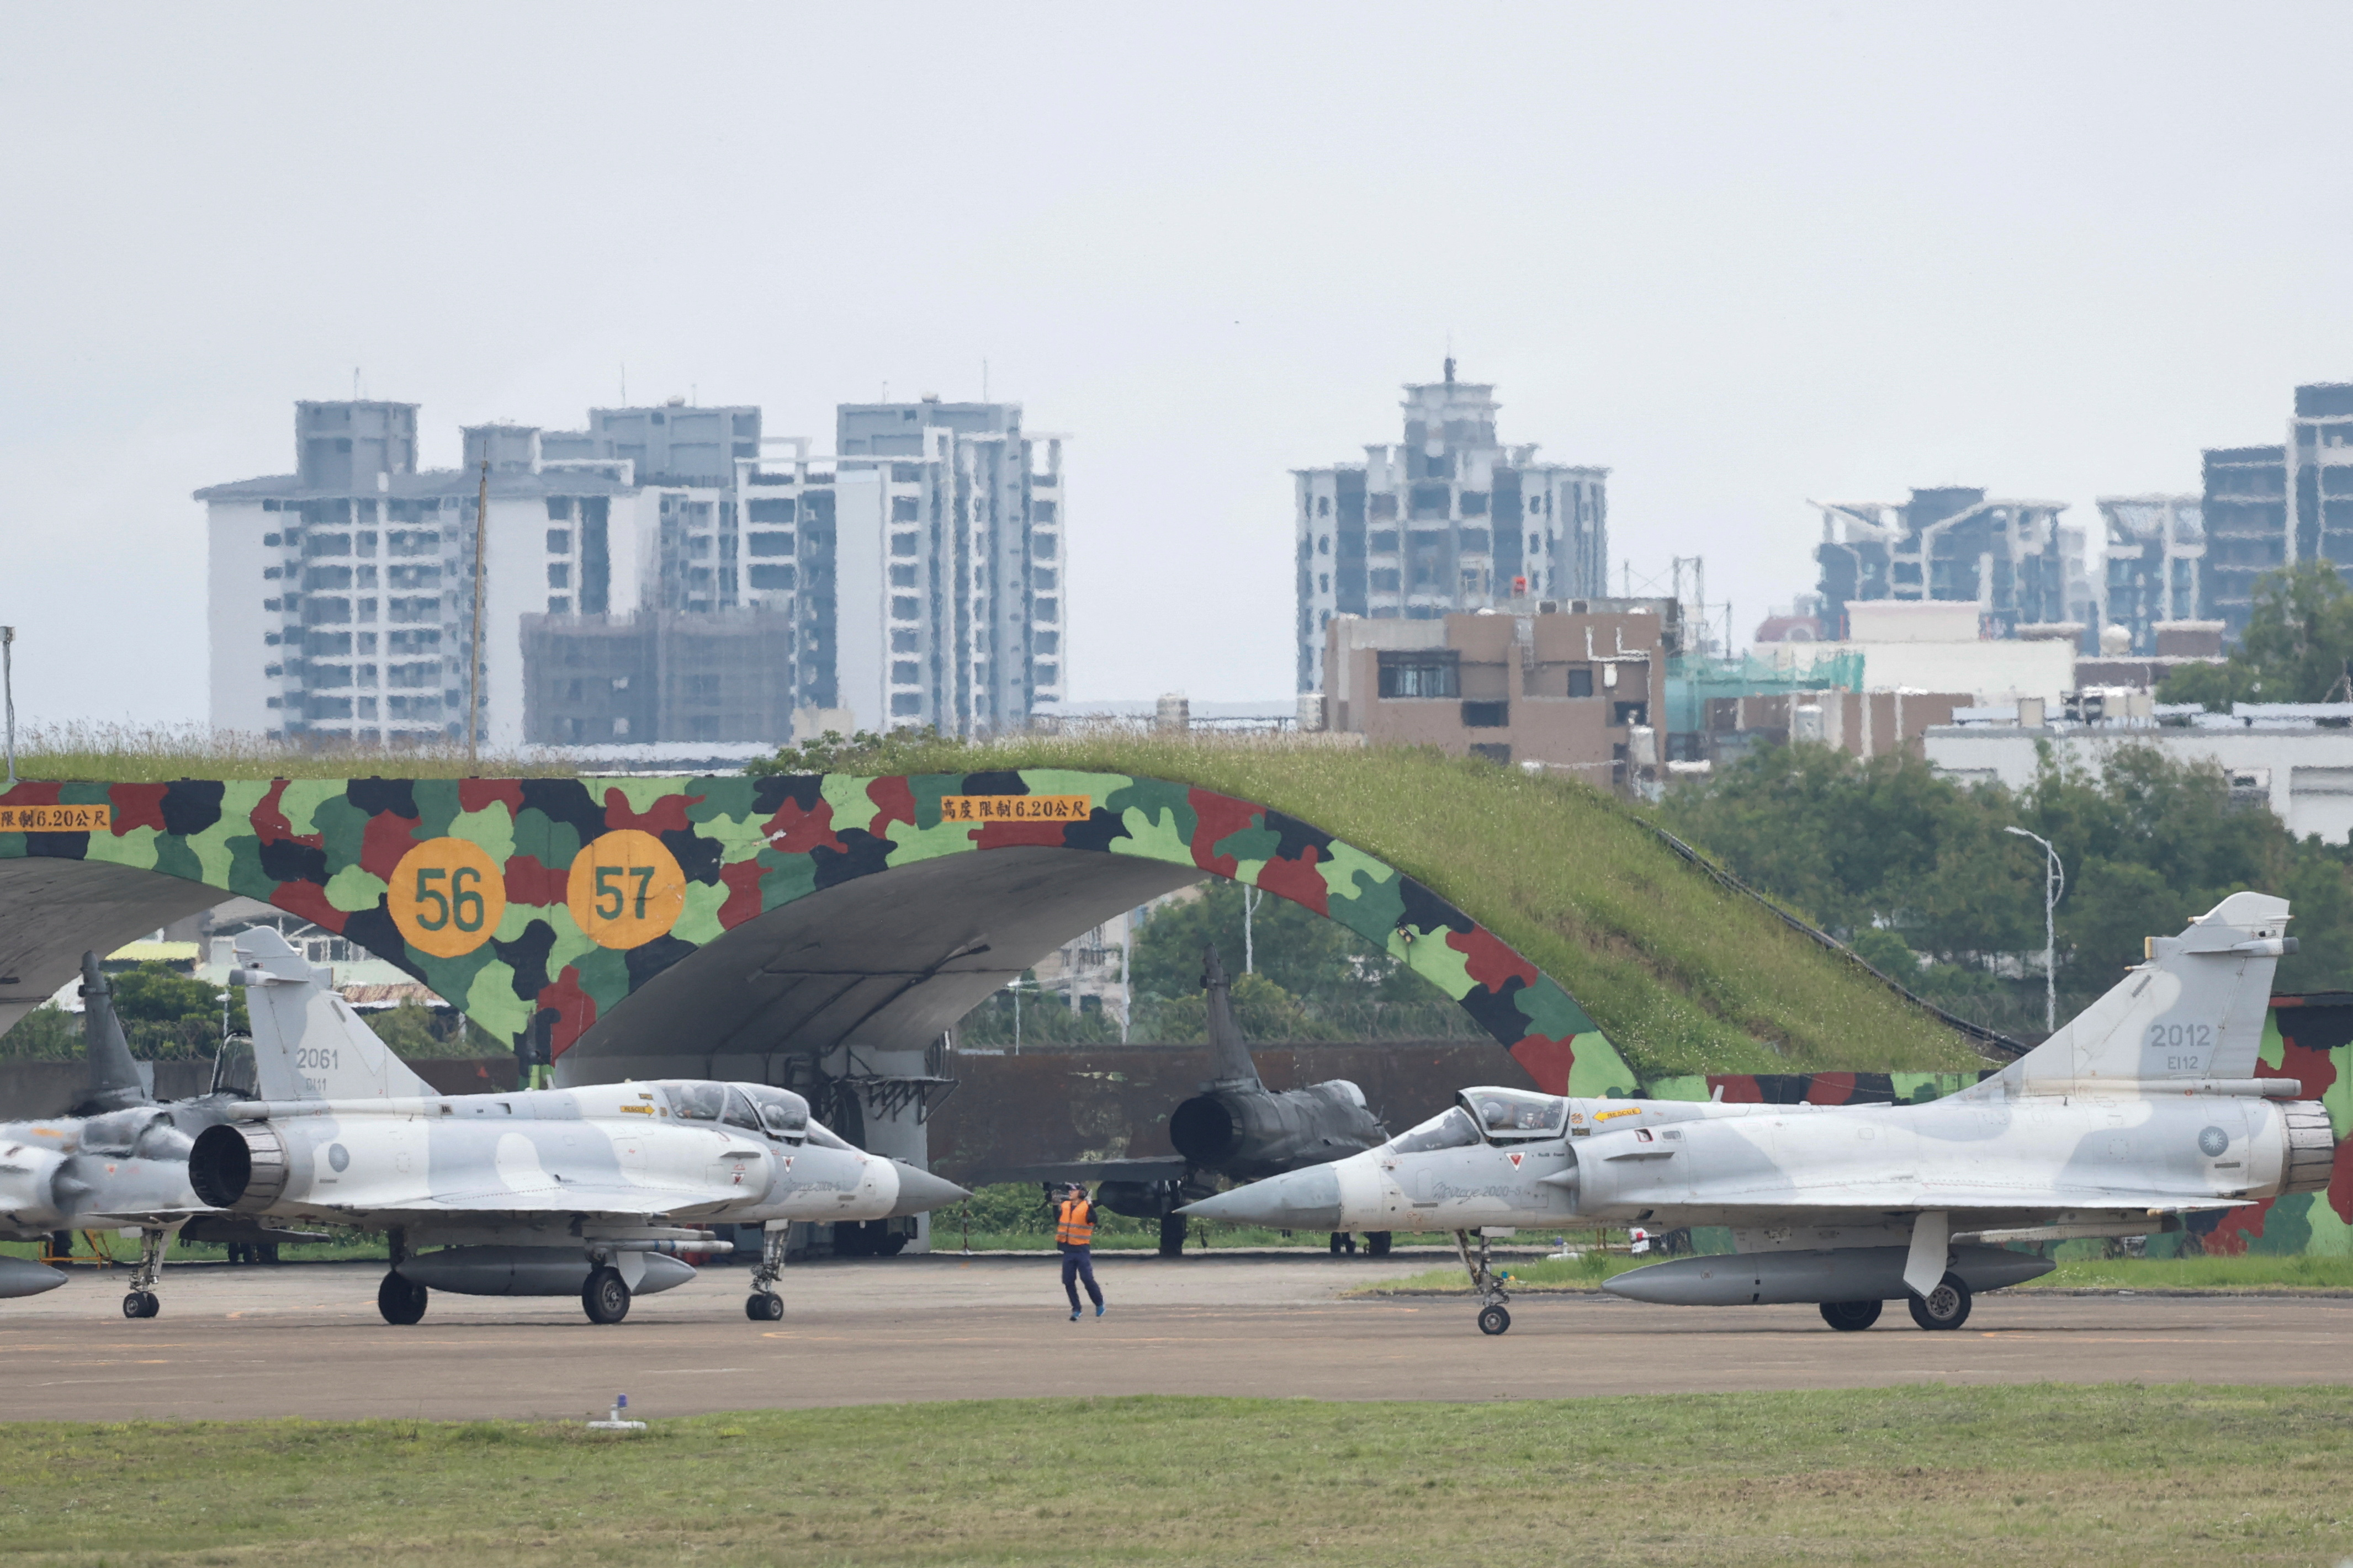
A ground staff gestures to Taiwan Air Force Mirage 2000-5 aircraft preparing to take off at Hsinchu Air Base, in Hsinchu, Taiwan May 23, 2024. REUTERS/Carlos Garcia Rawlins A furious China launched "punishment" drills around Taiwan on Thursday in what it said was a response to "separatist acts", sending up heavily armed warplanes and staging mock attacks as state media denounced newly inaugurated President Lai Ching-te.