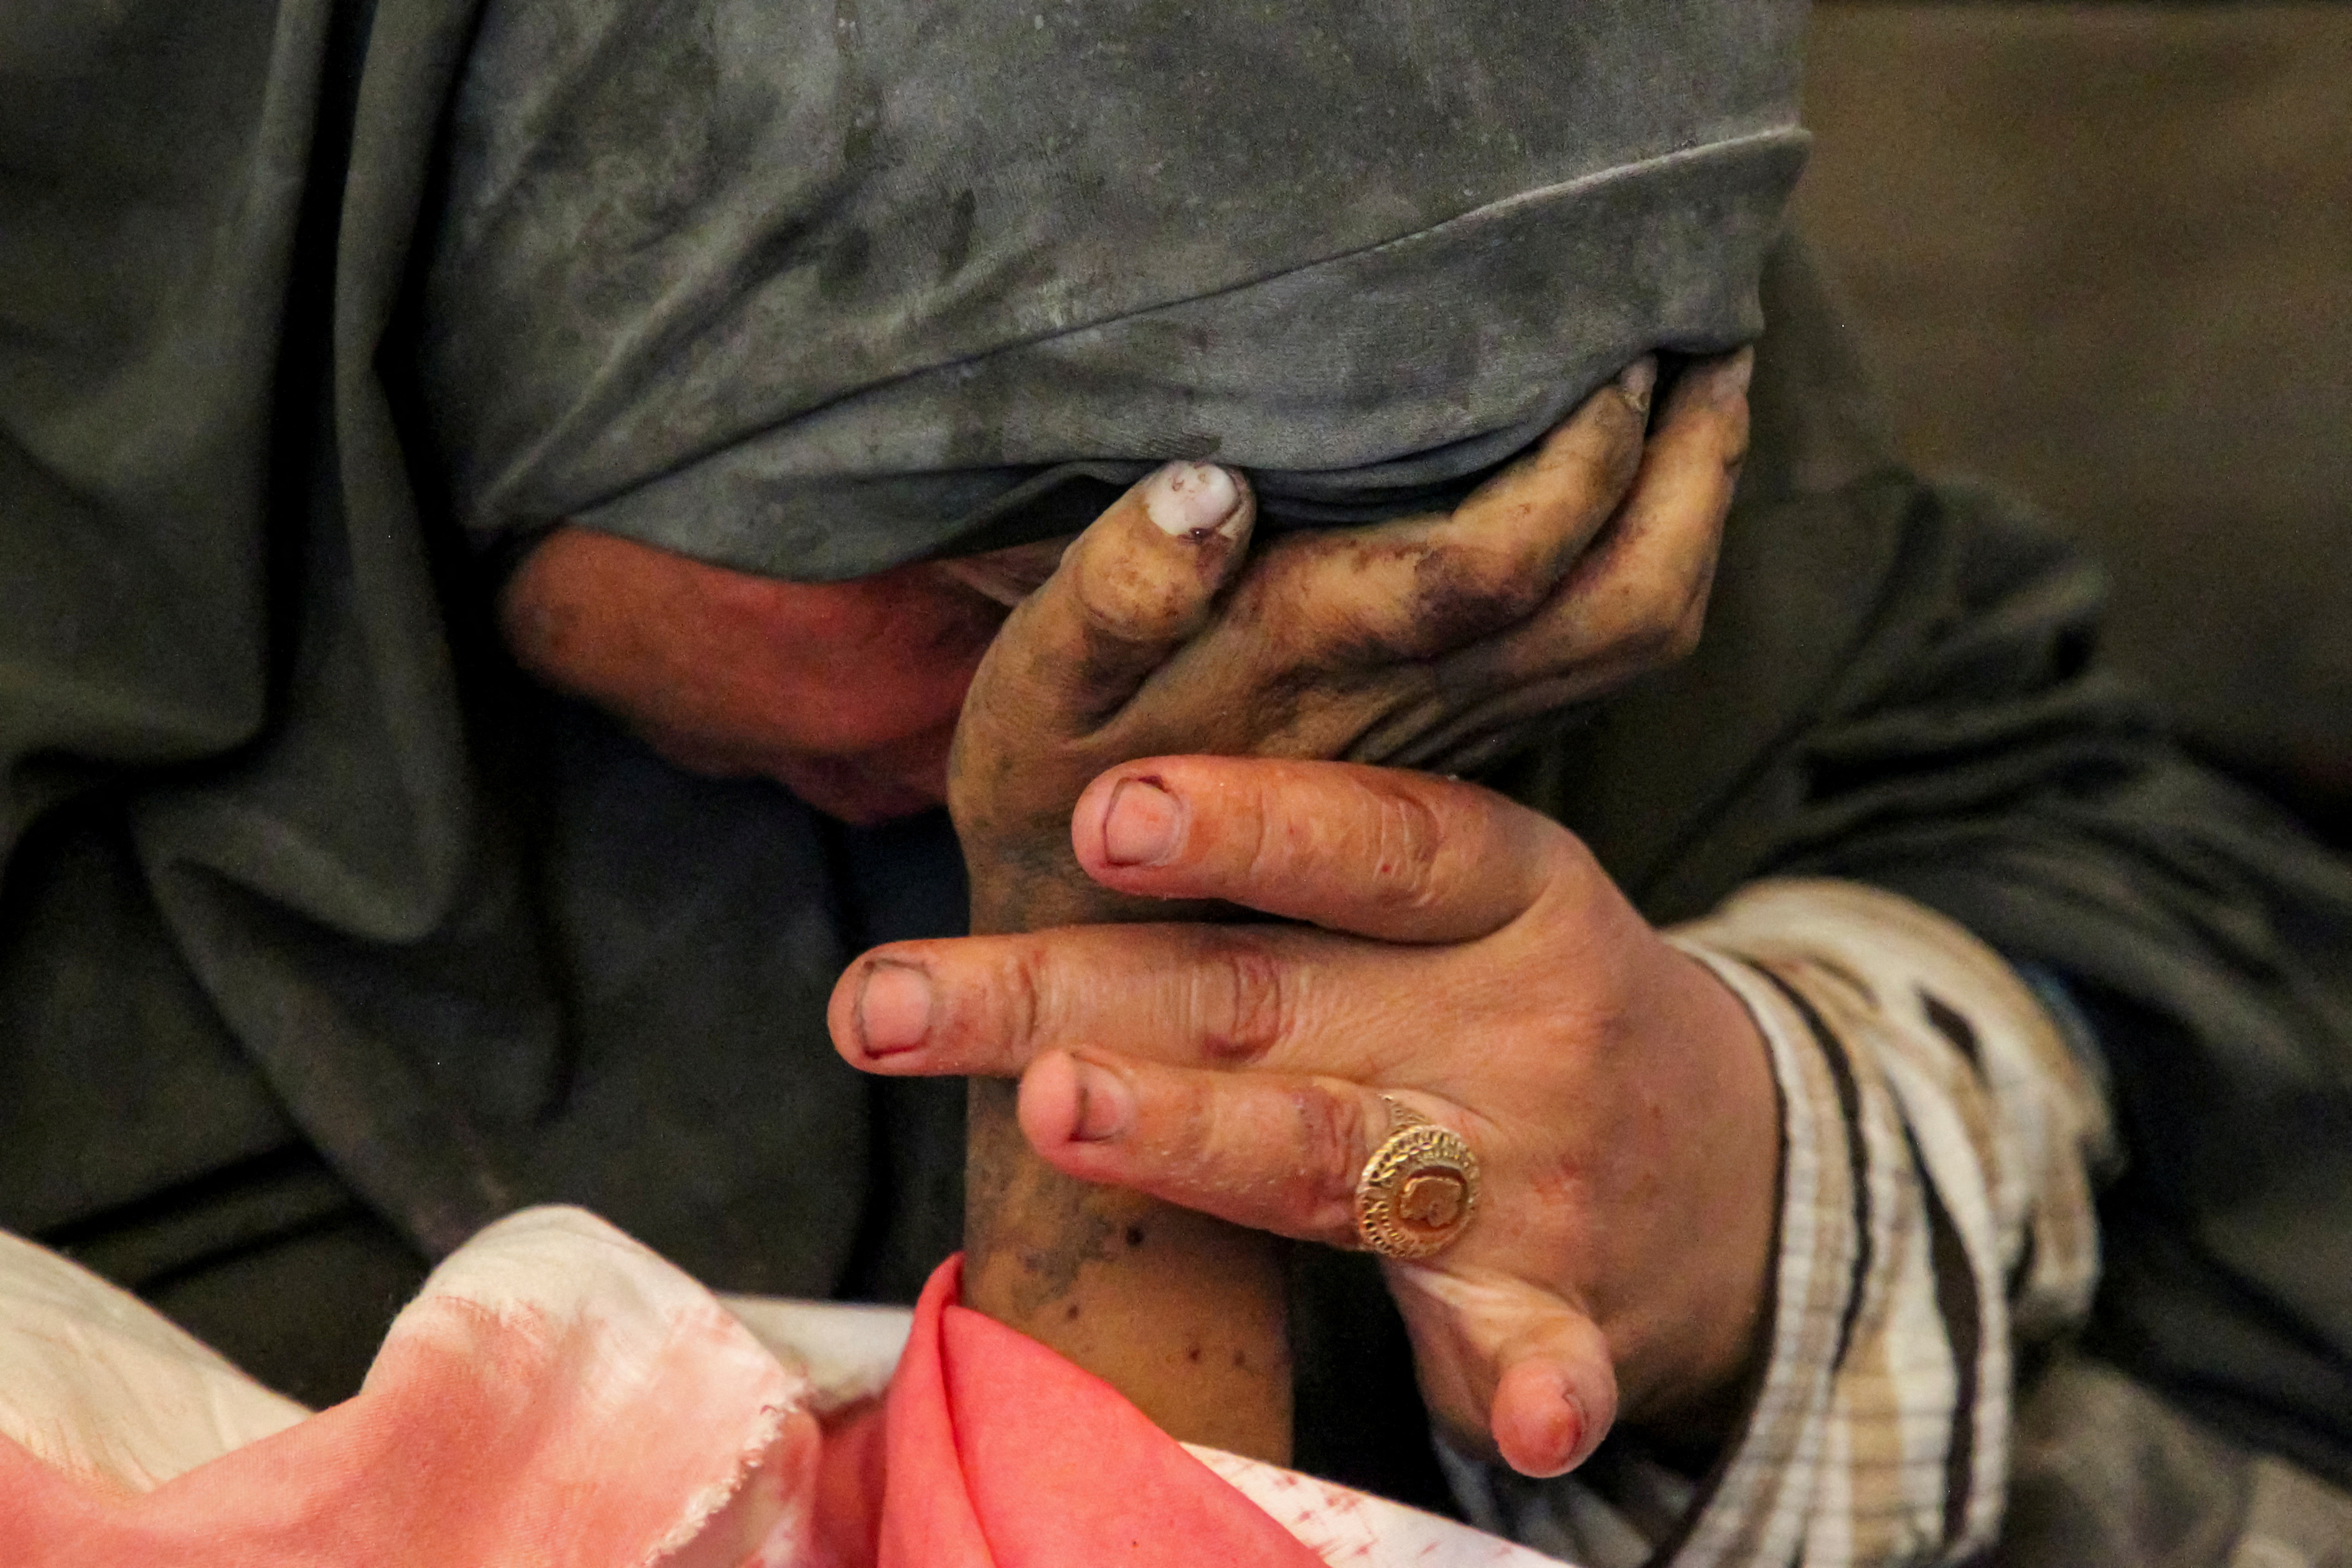
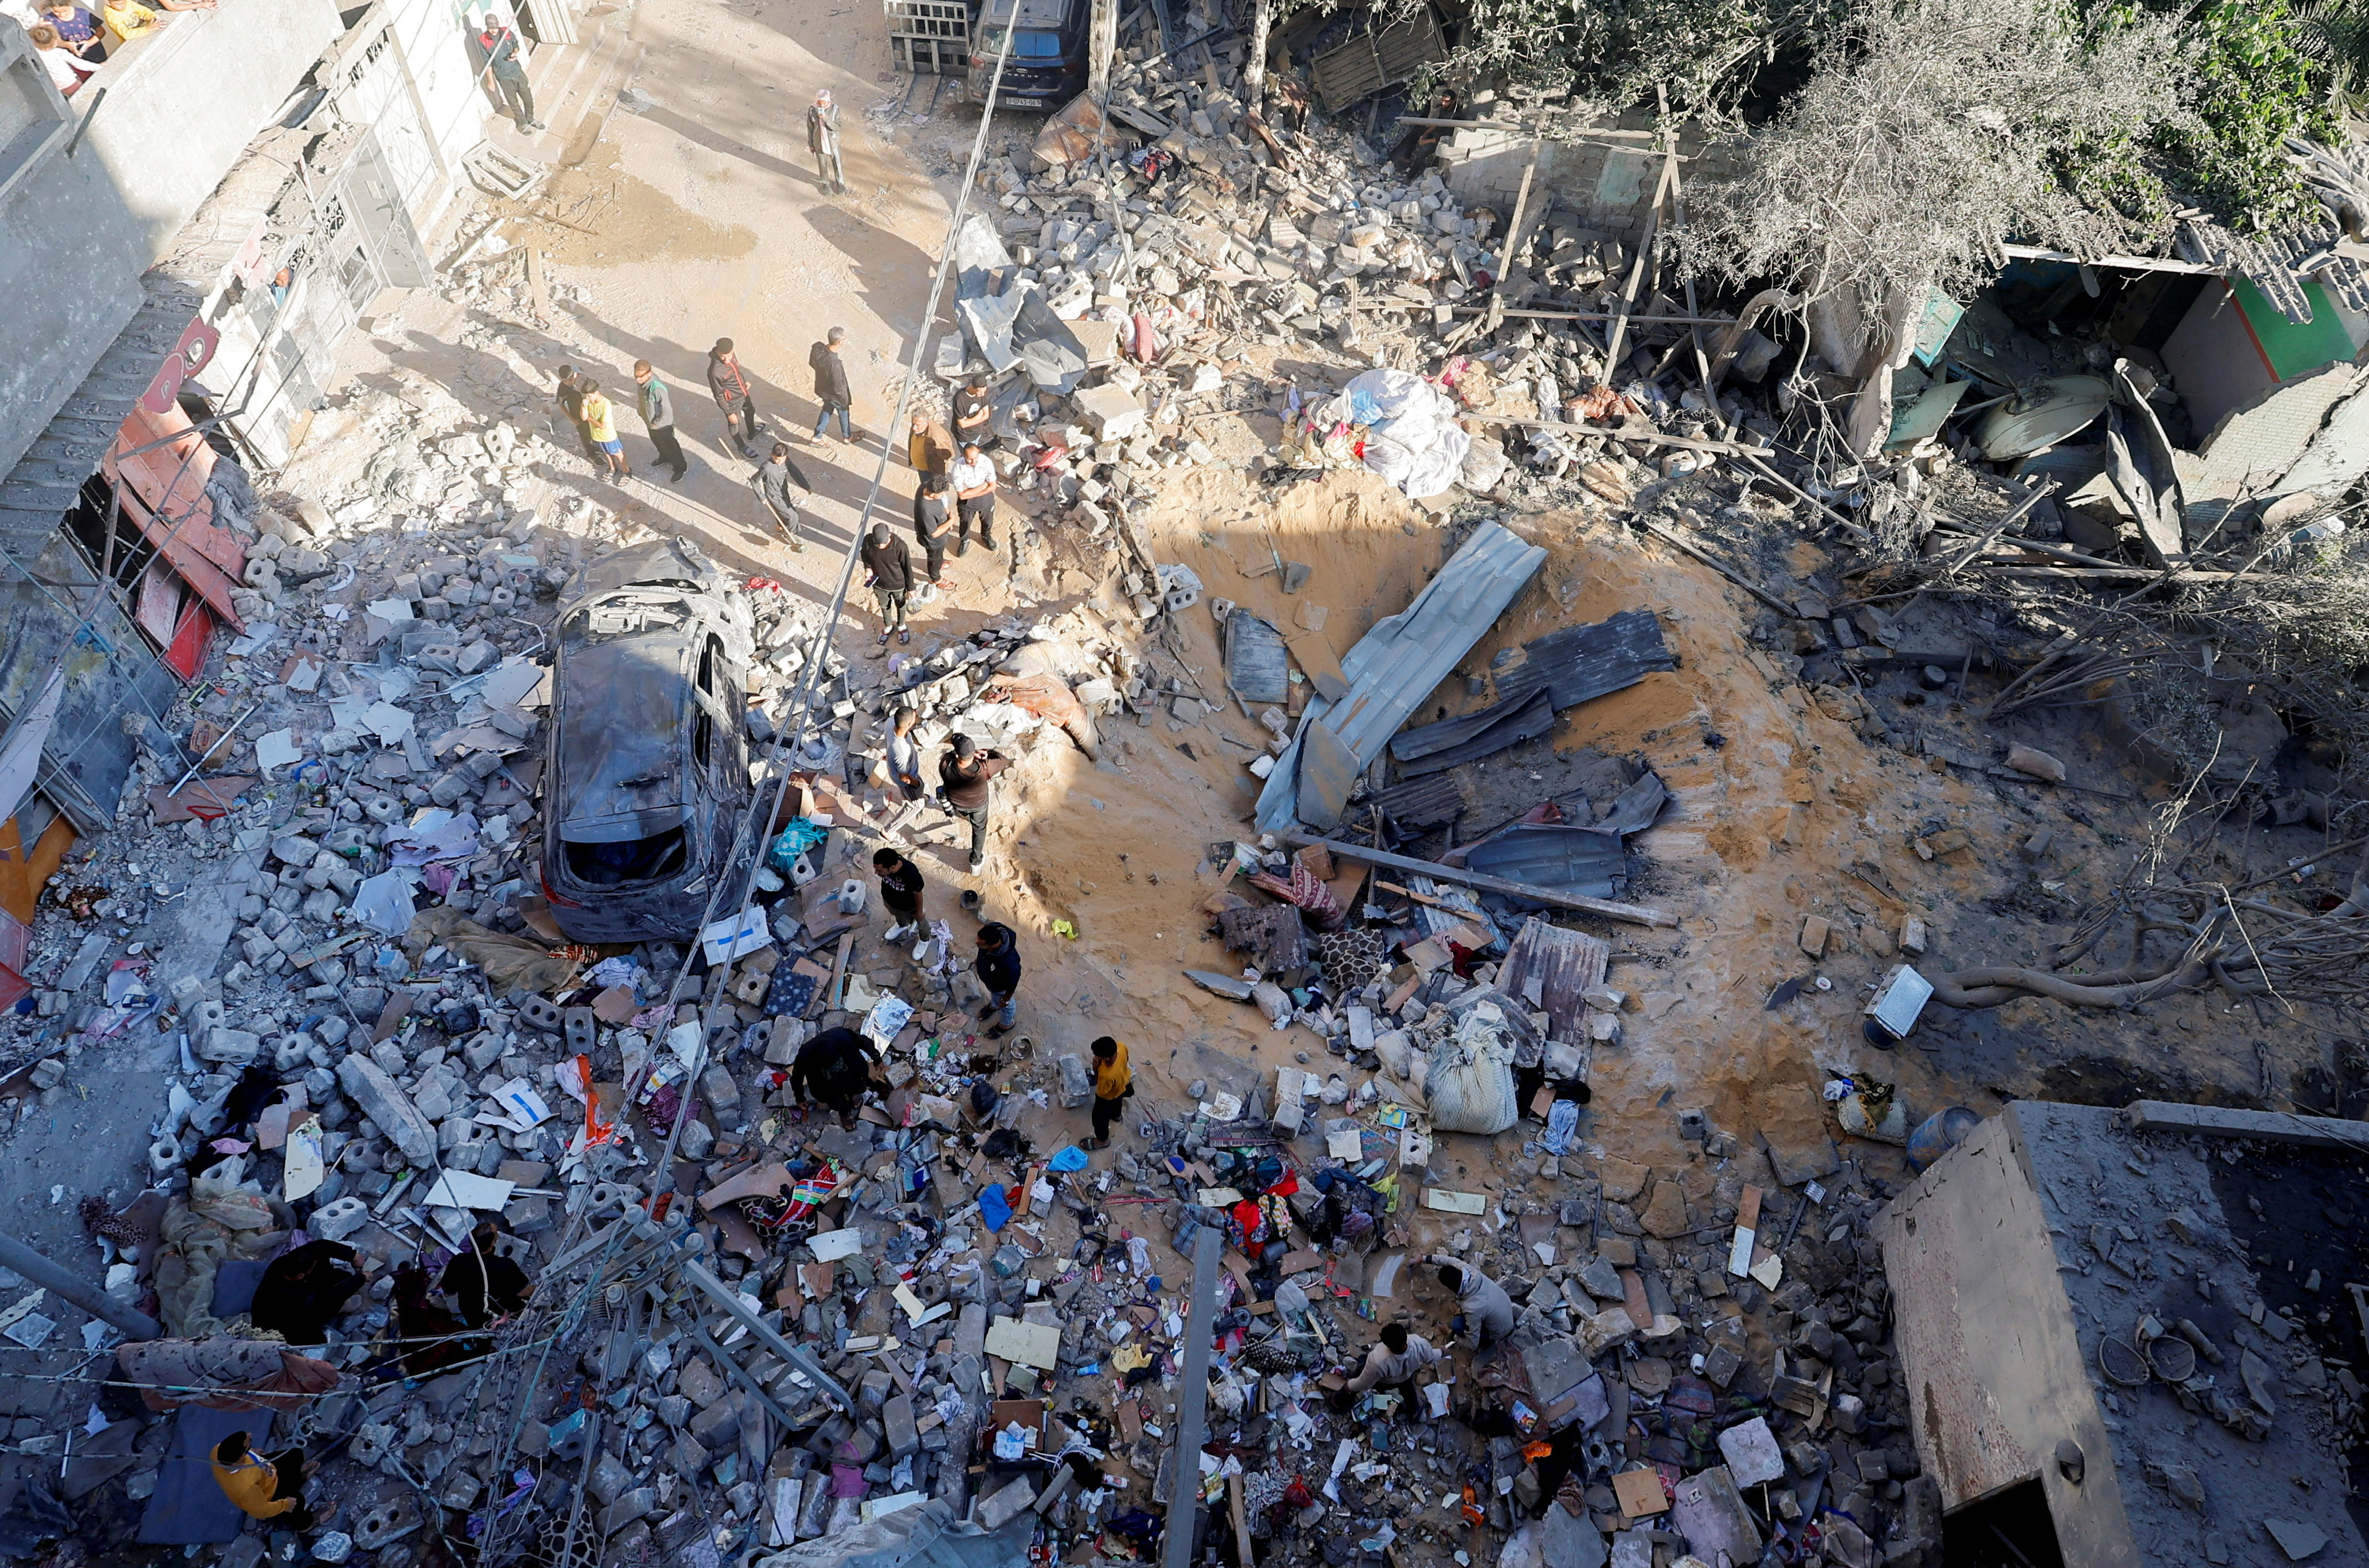
US says Israel's use of weapons may have violated international law
May 8, 2024. REUTERS/Mohammed Salem The Biden administration on Friday said Israel's use of U.S.-supplied weapons may have violated international humanitarian law during its military operation in Gaza, in its strongest criticism to date of Israel.

Markets


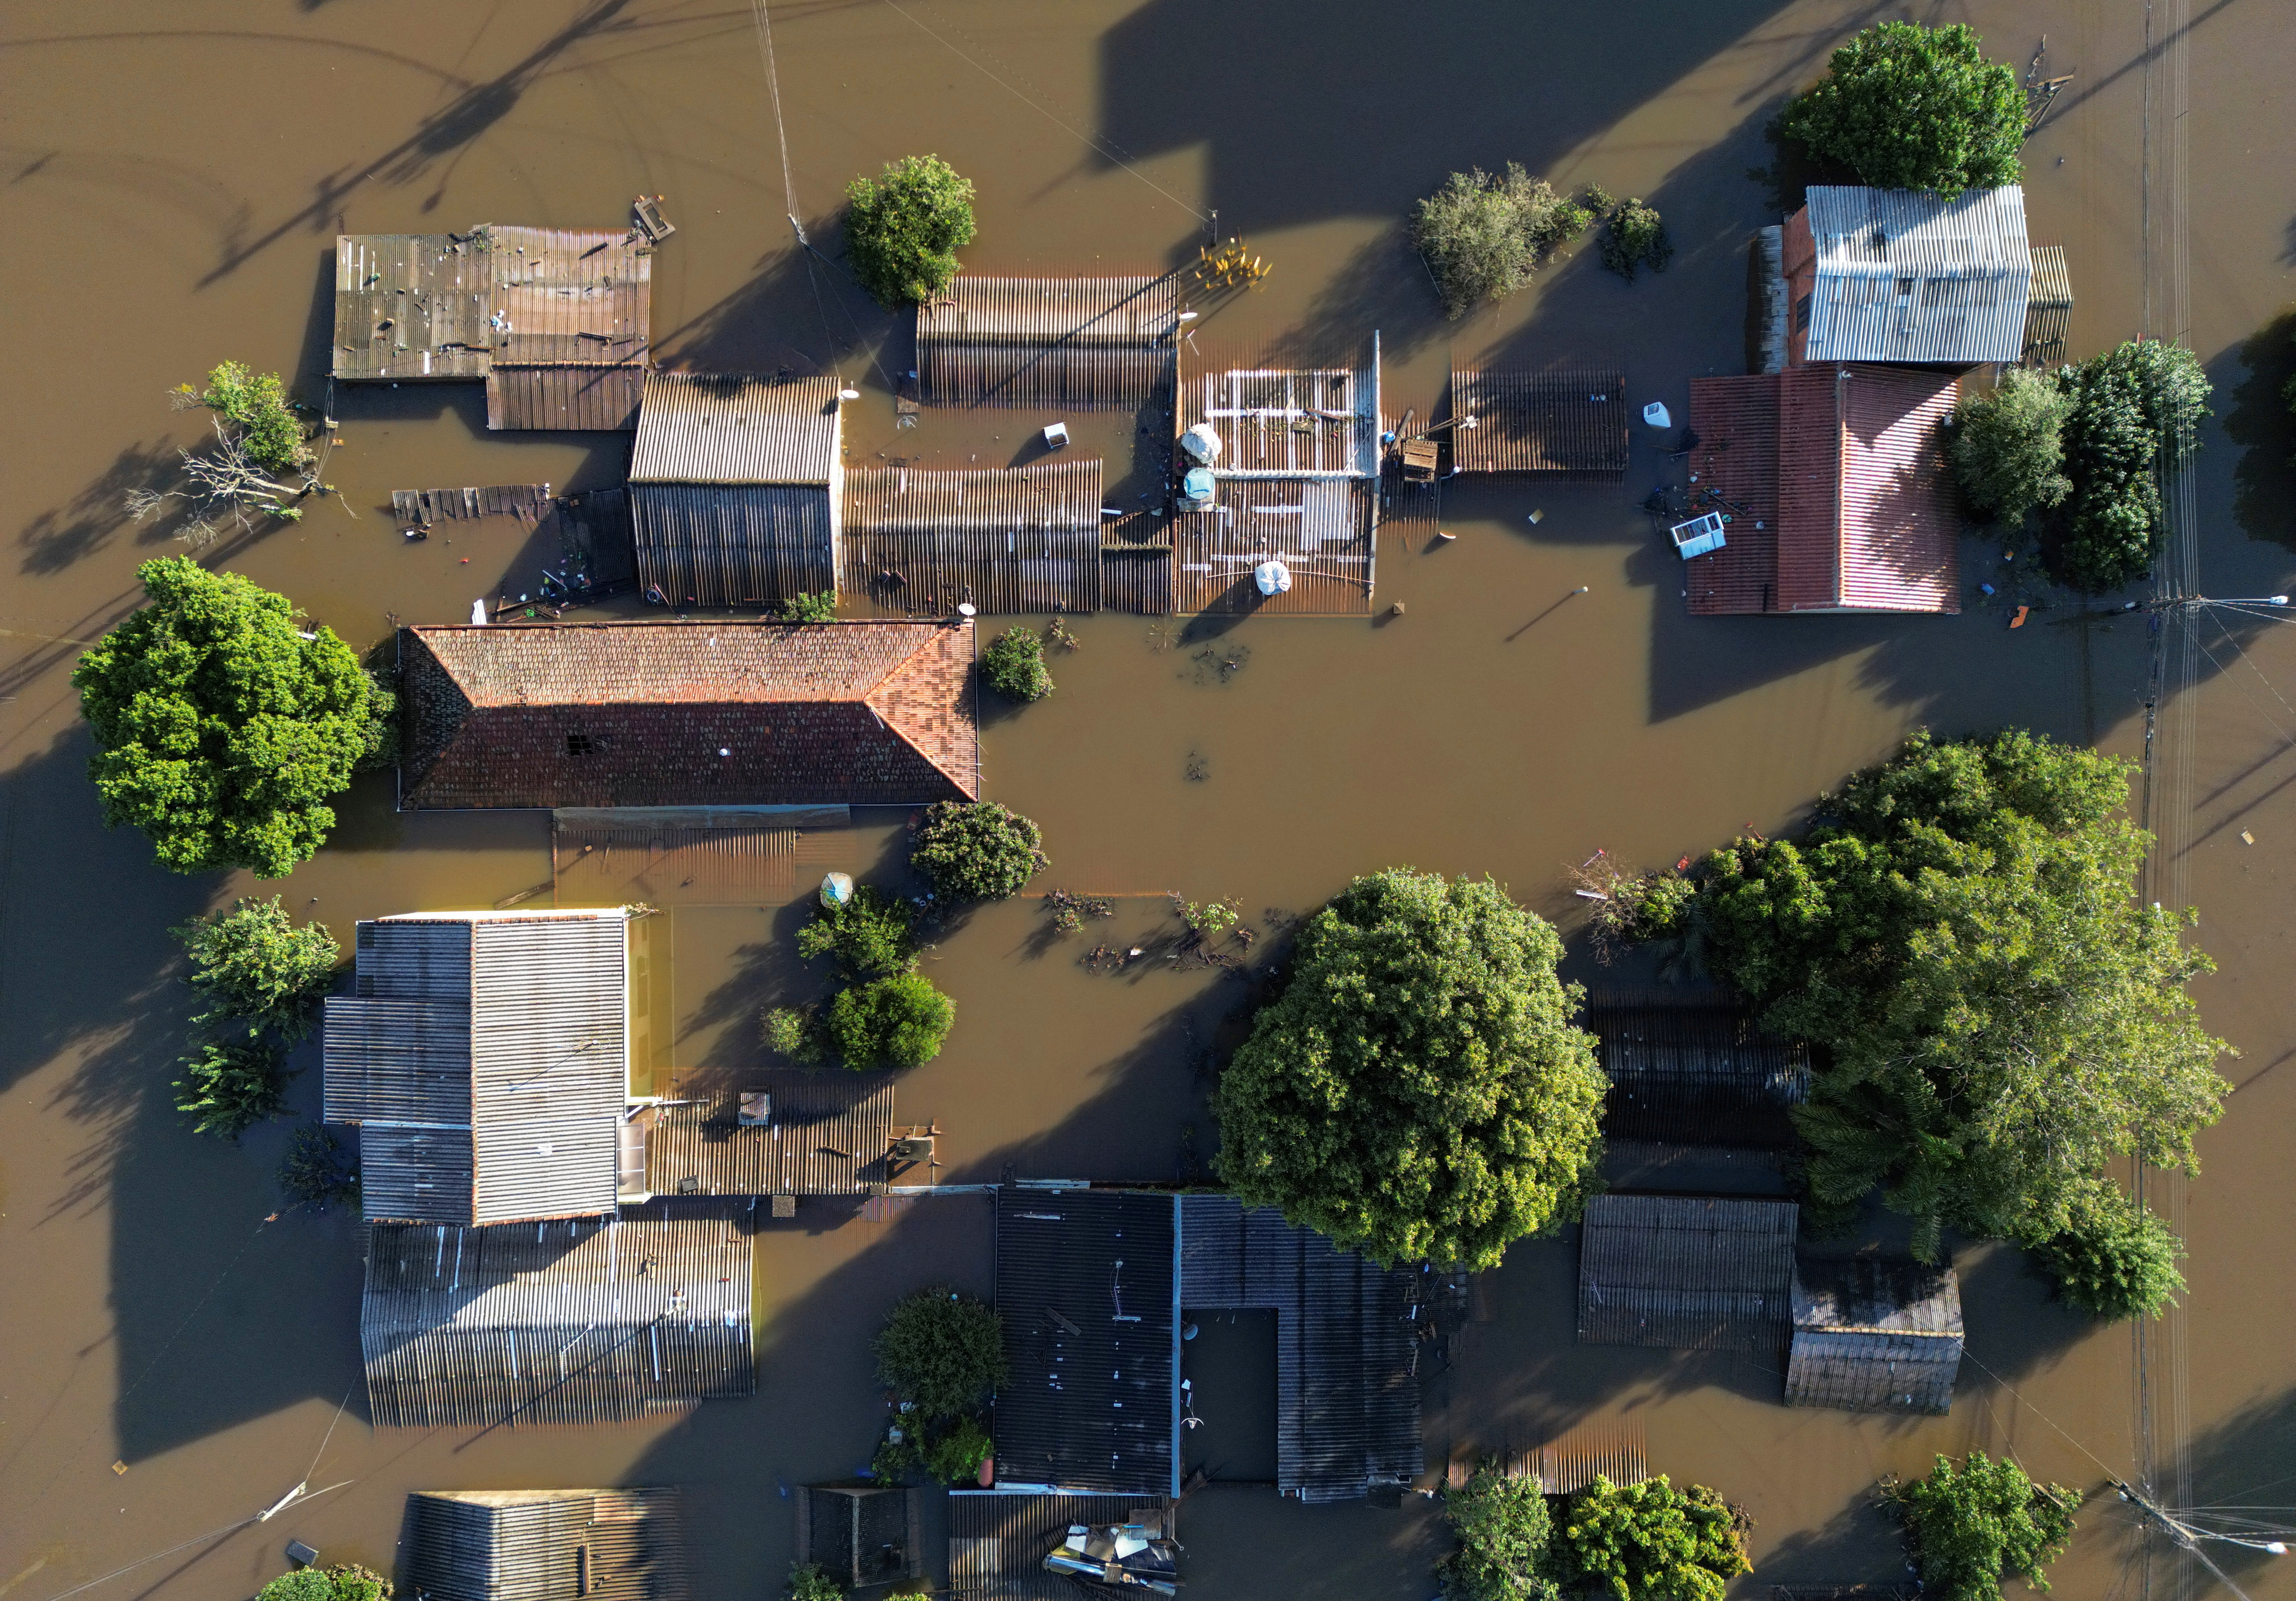
EnvironmentDeath toll from Brazil floods hits 126
Storms and floods battering Rio Grande do Sul left more than 340,000 displaced with another 141 unaccounted for
Talking Points
Campus protests


Giant blue-grey sei whales make a comeback 100 years after vanishing
The whales that vanished from Argentina's Patagonian coast due to hunting are starting to flourish once again.