China's factories fire up but consumer, property weakness persists
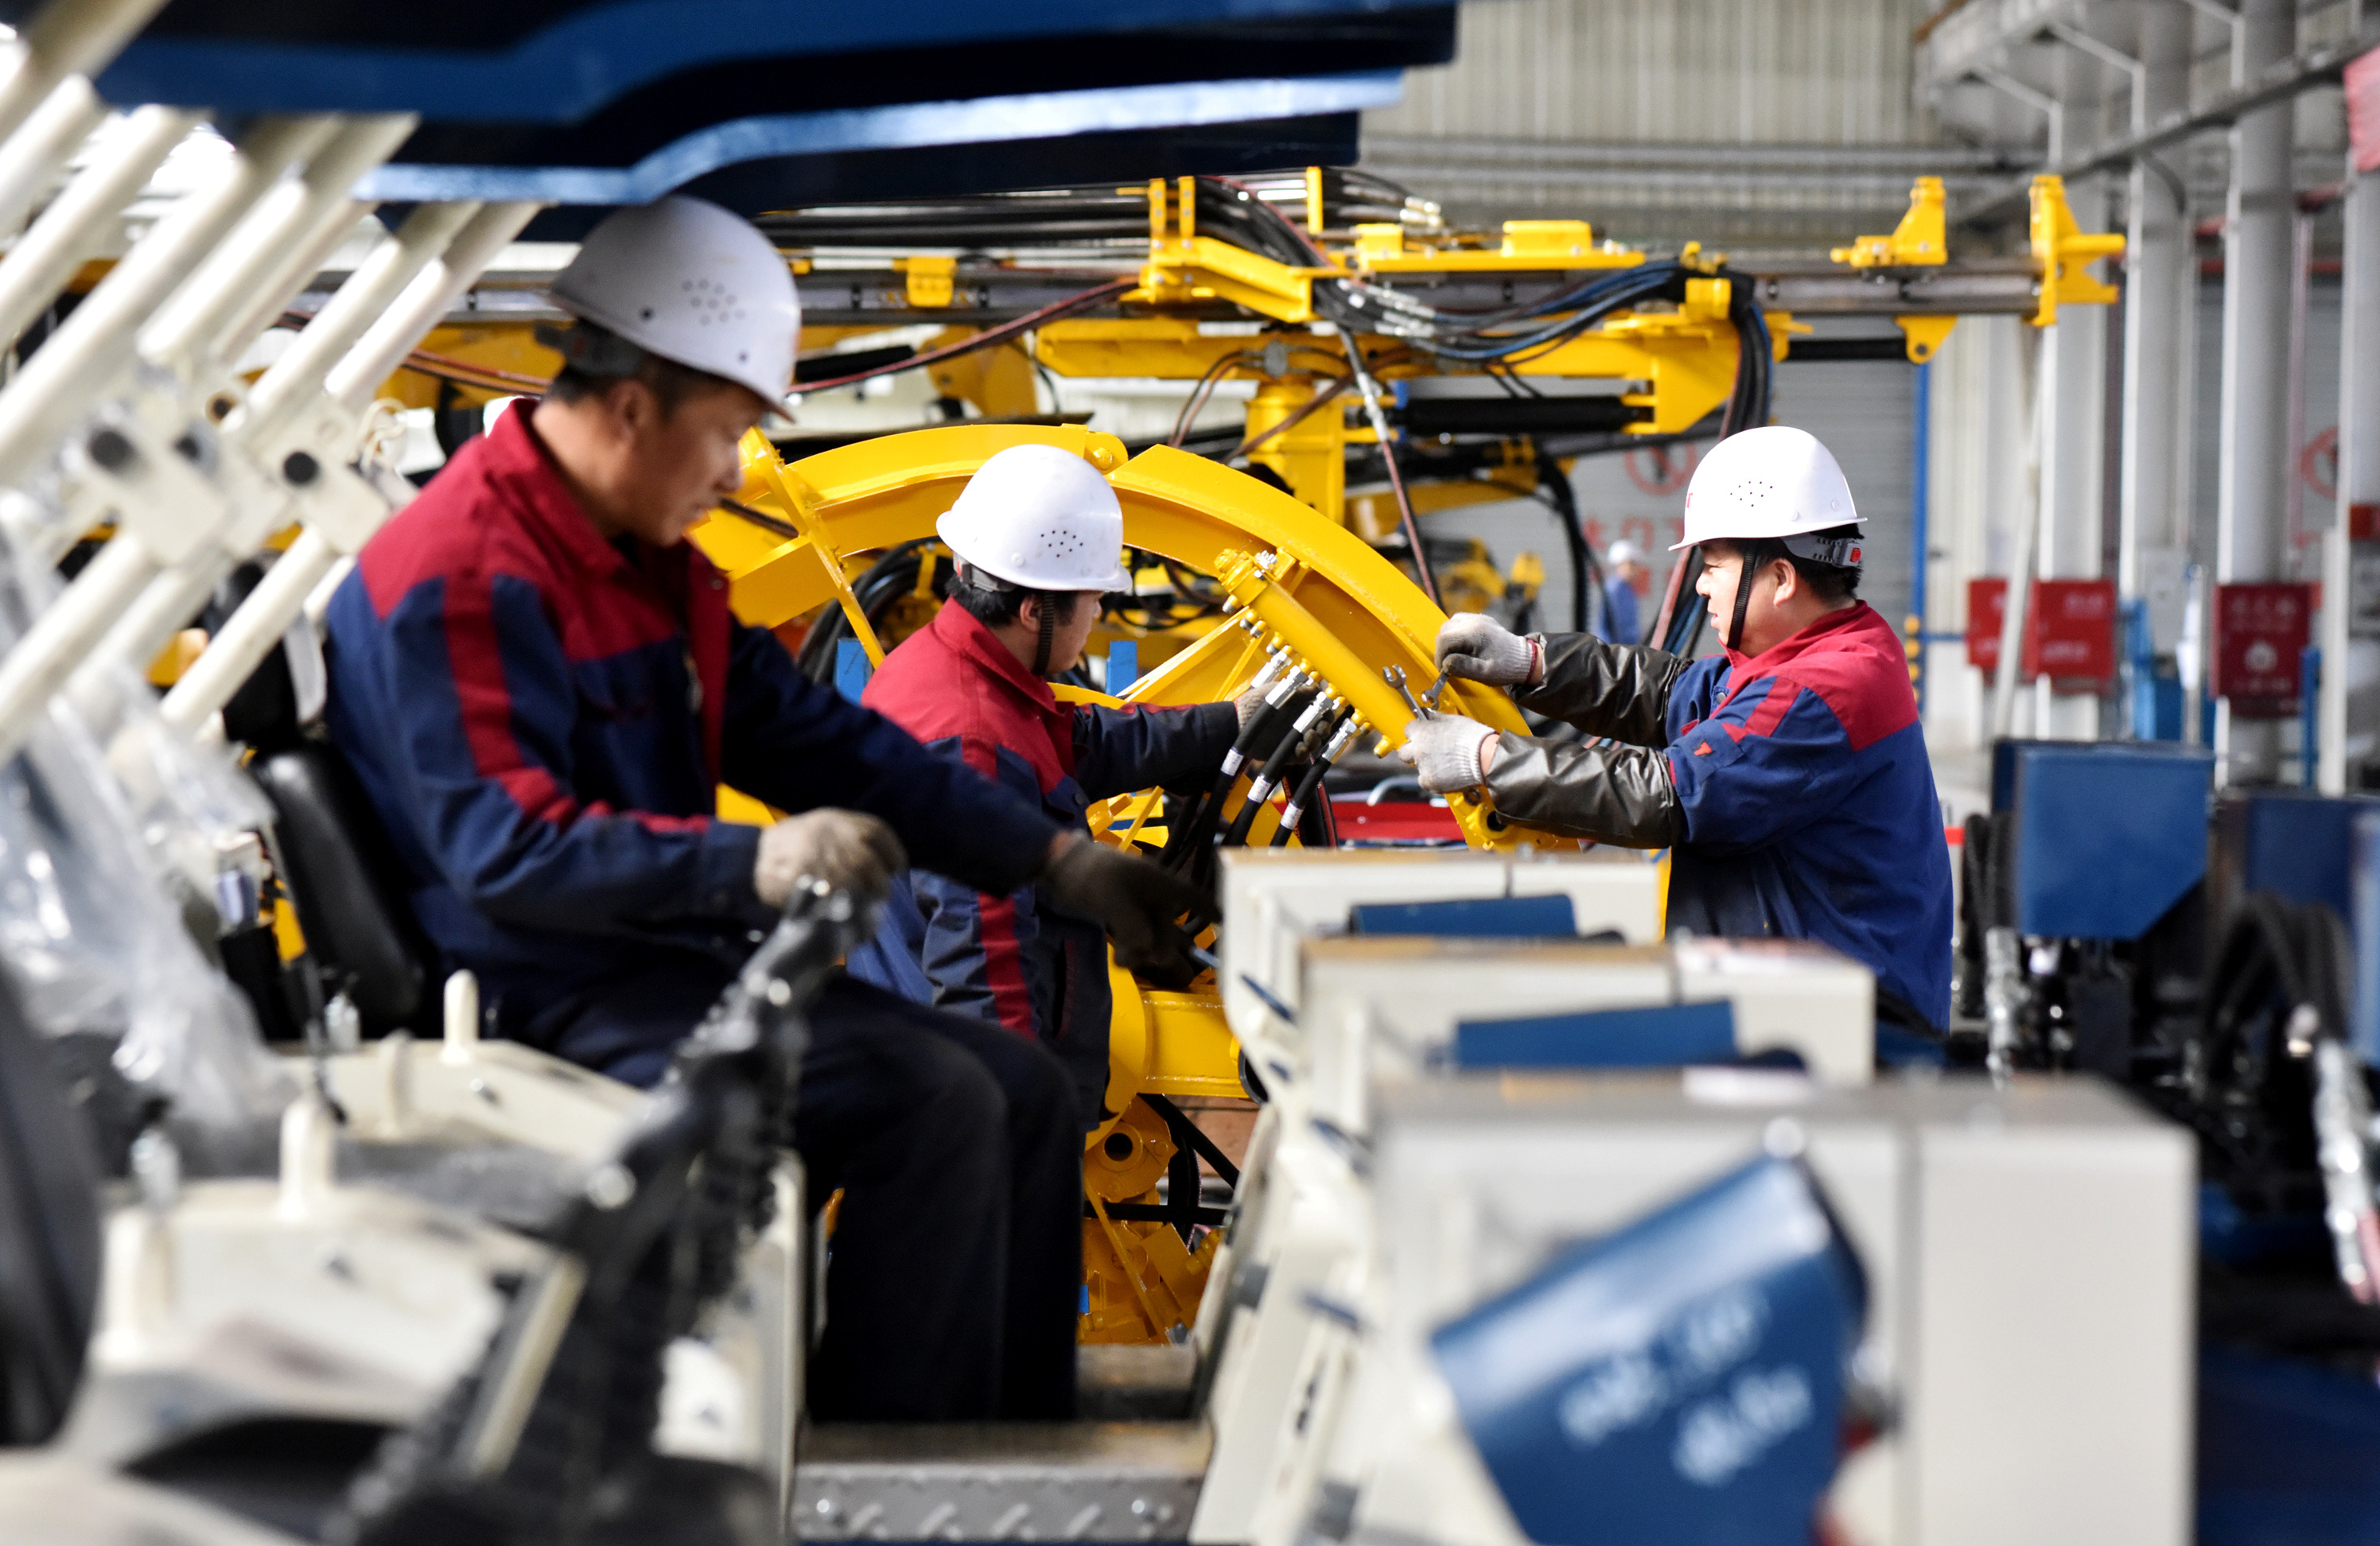
Employees work on a drilling machine production line at a factory in Zhangjiakou, Hebei province, China November 14, 2018. REUTERS/Stringer/File Photo China's factory output topped forecasts in April, helped by improving external demand, although retail sales unexpectedly slowed and the property sector remained a drag on the economy, piling pressure on Beijing to do more to support growth.