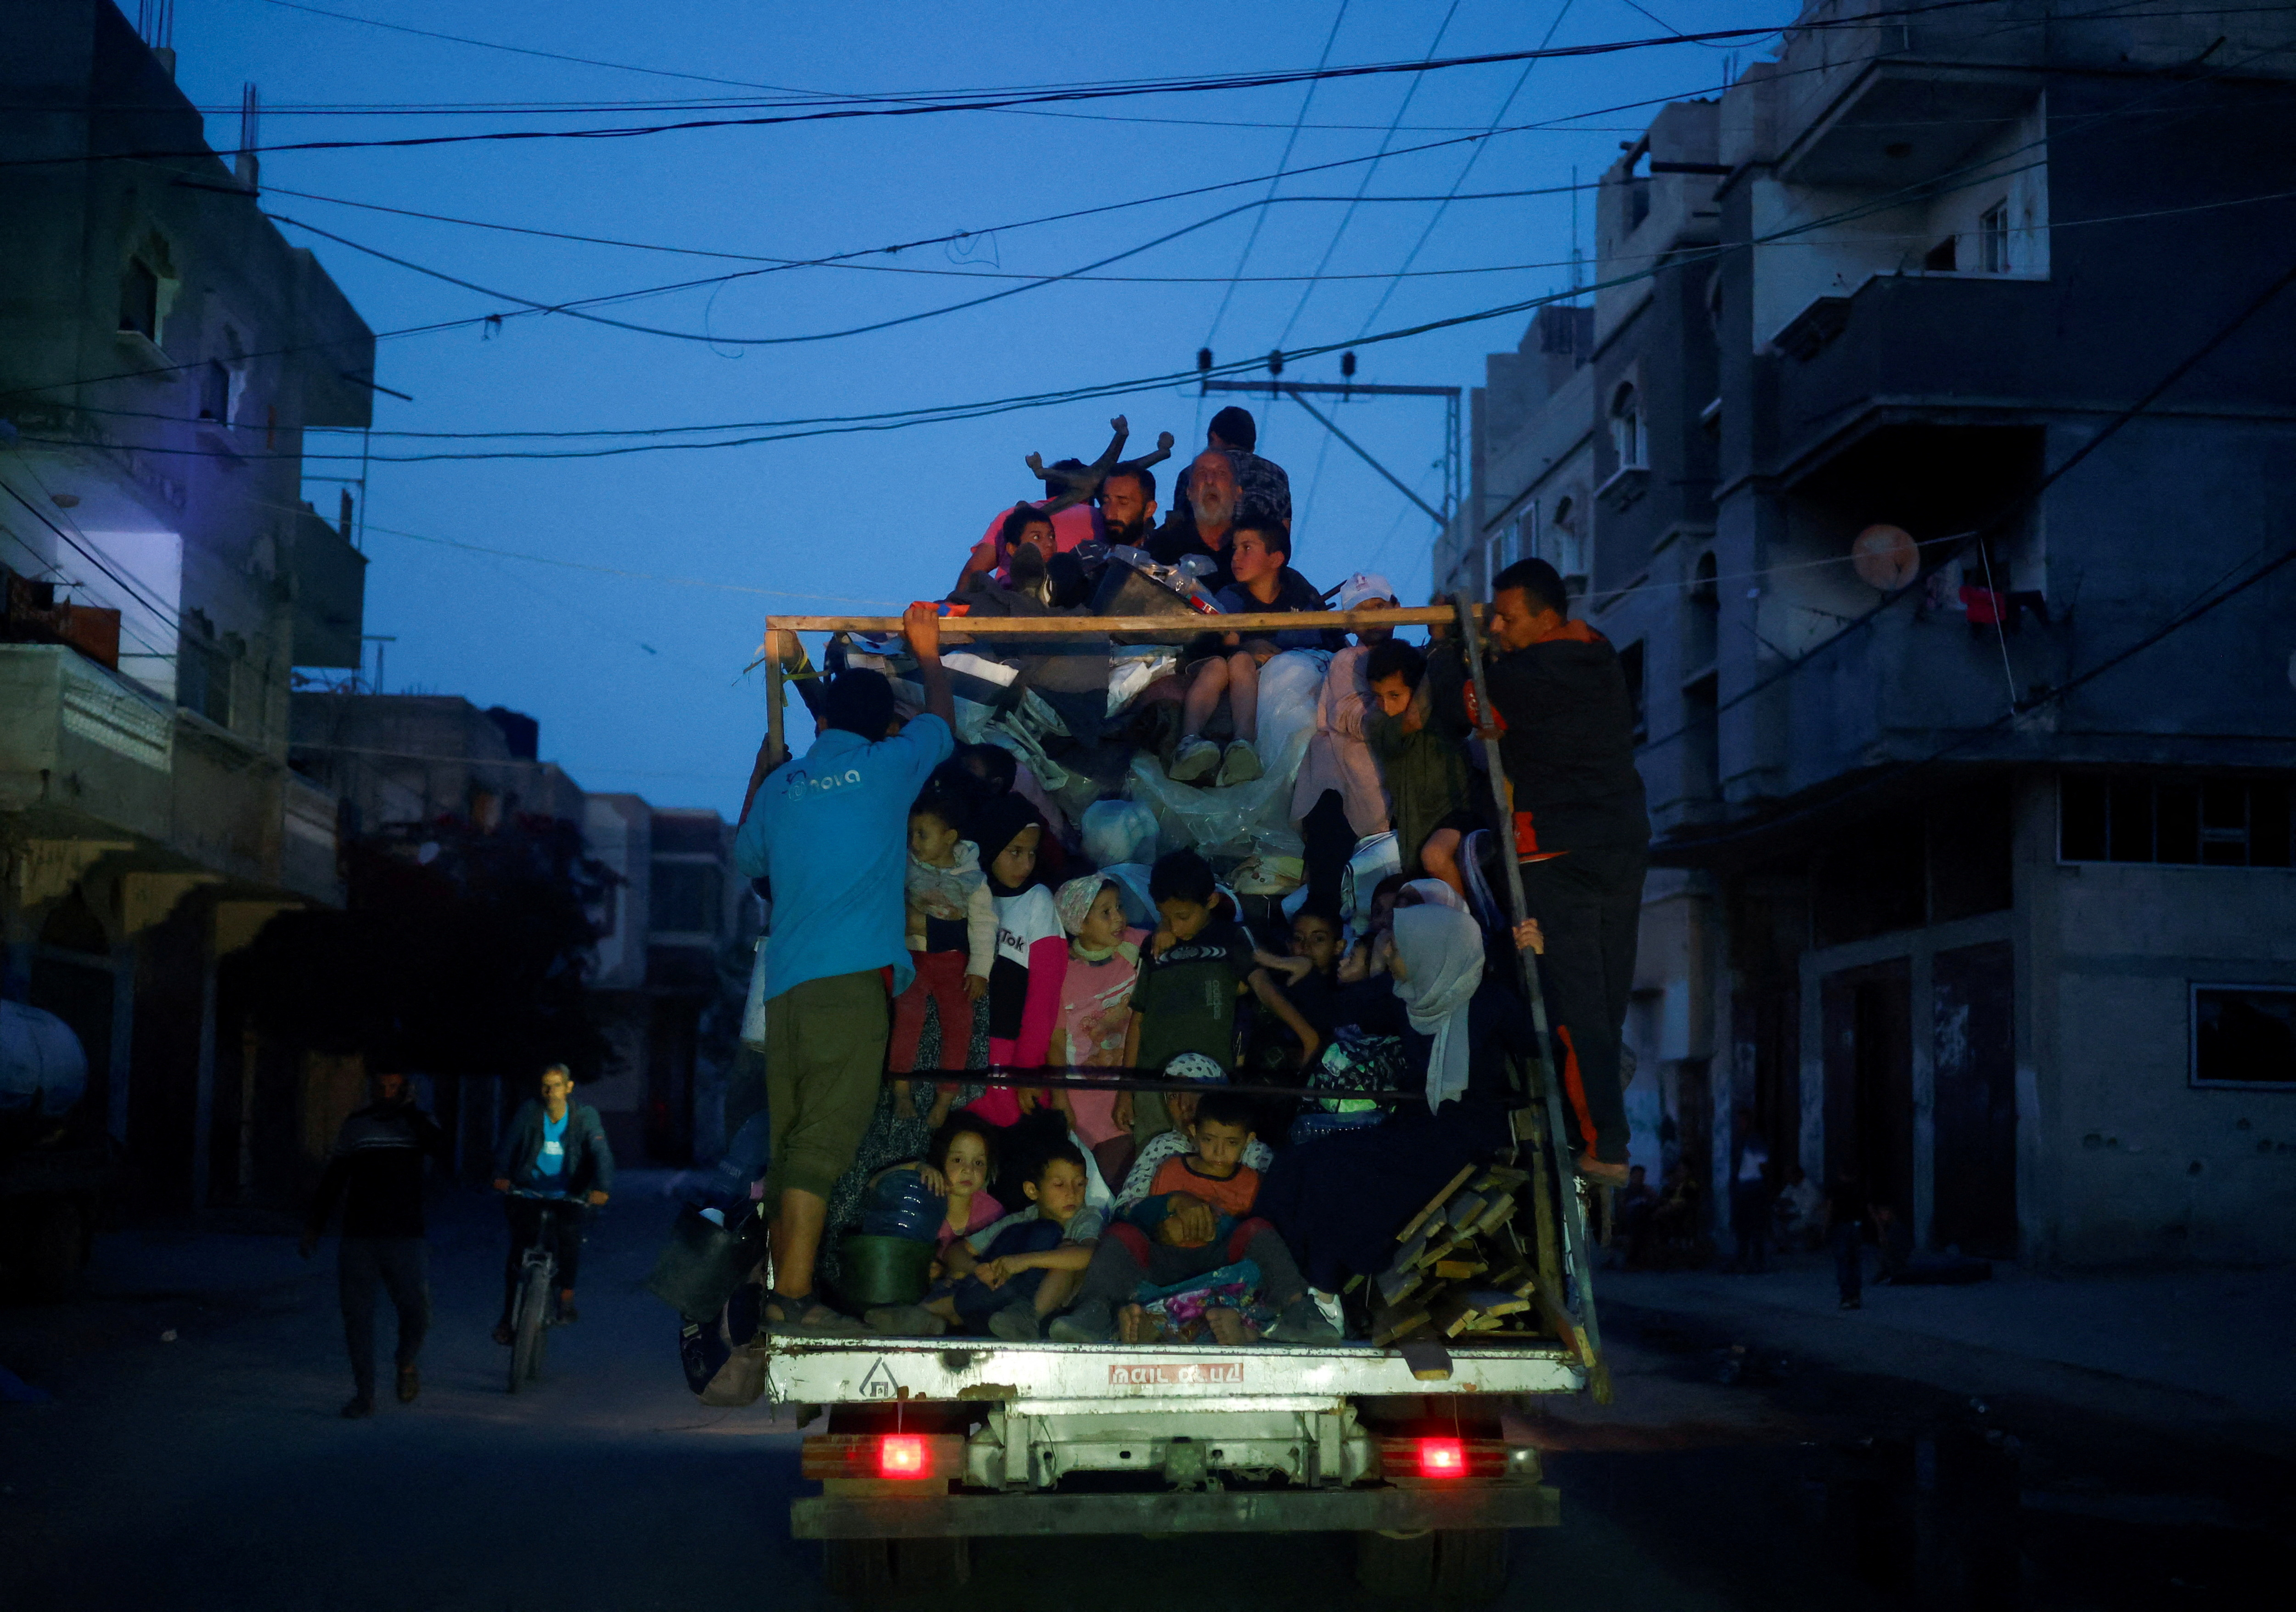
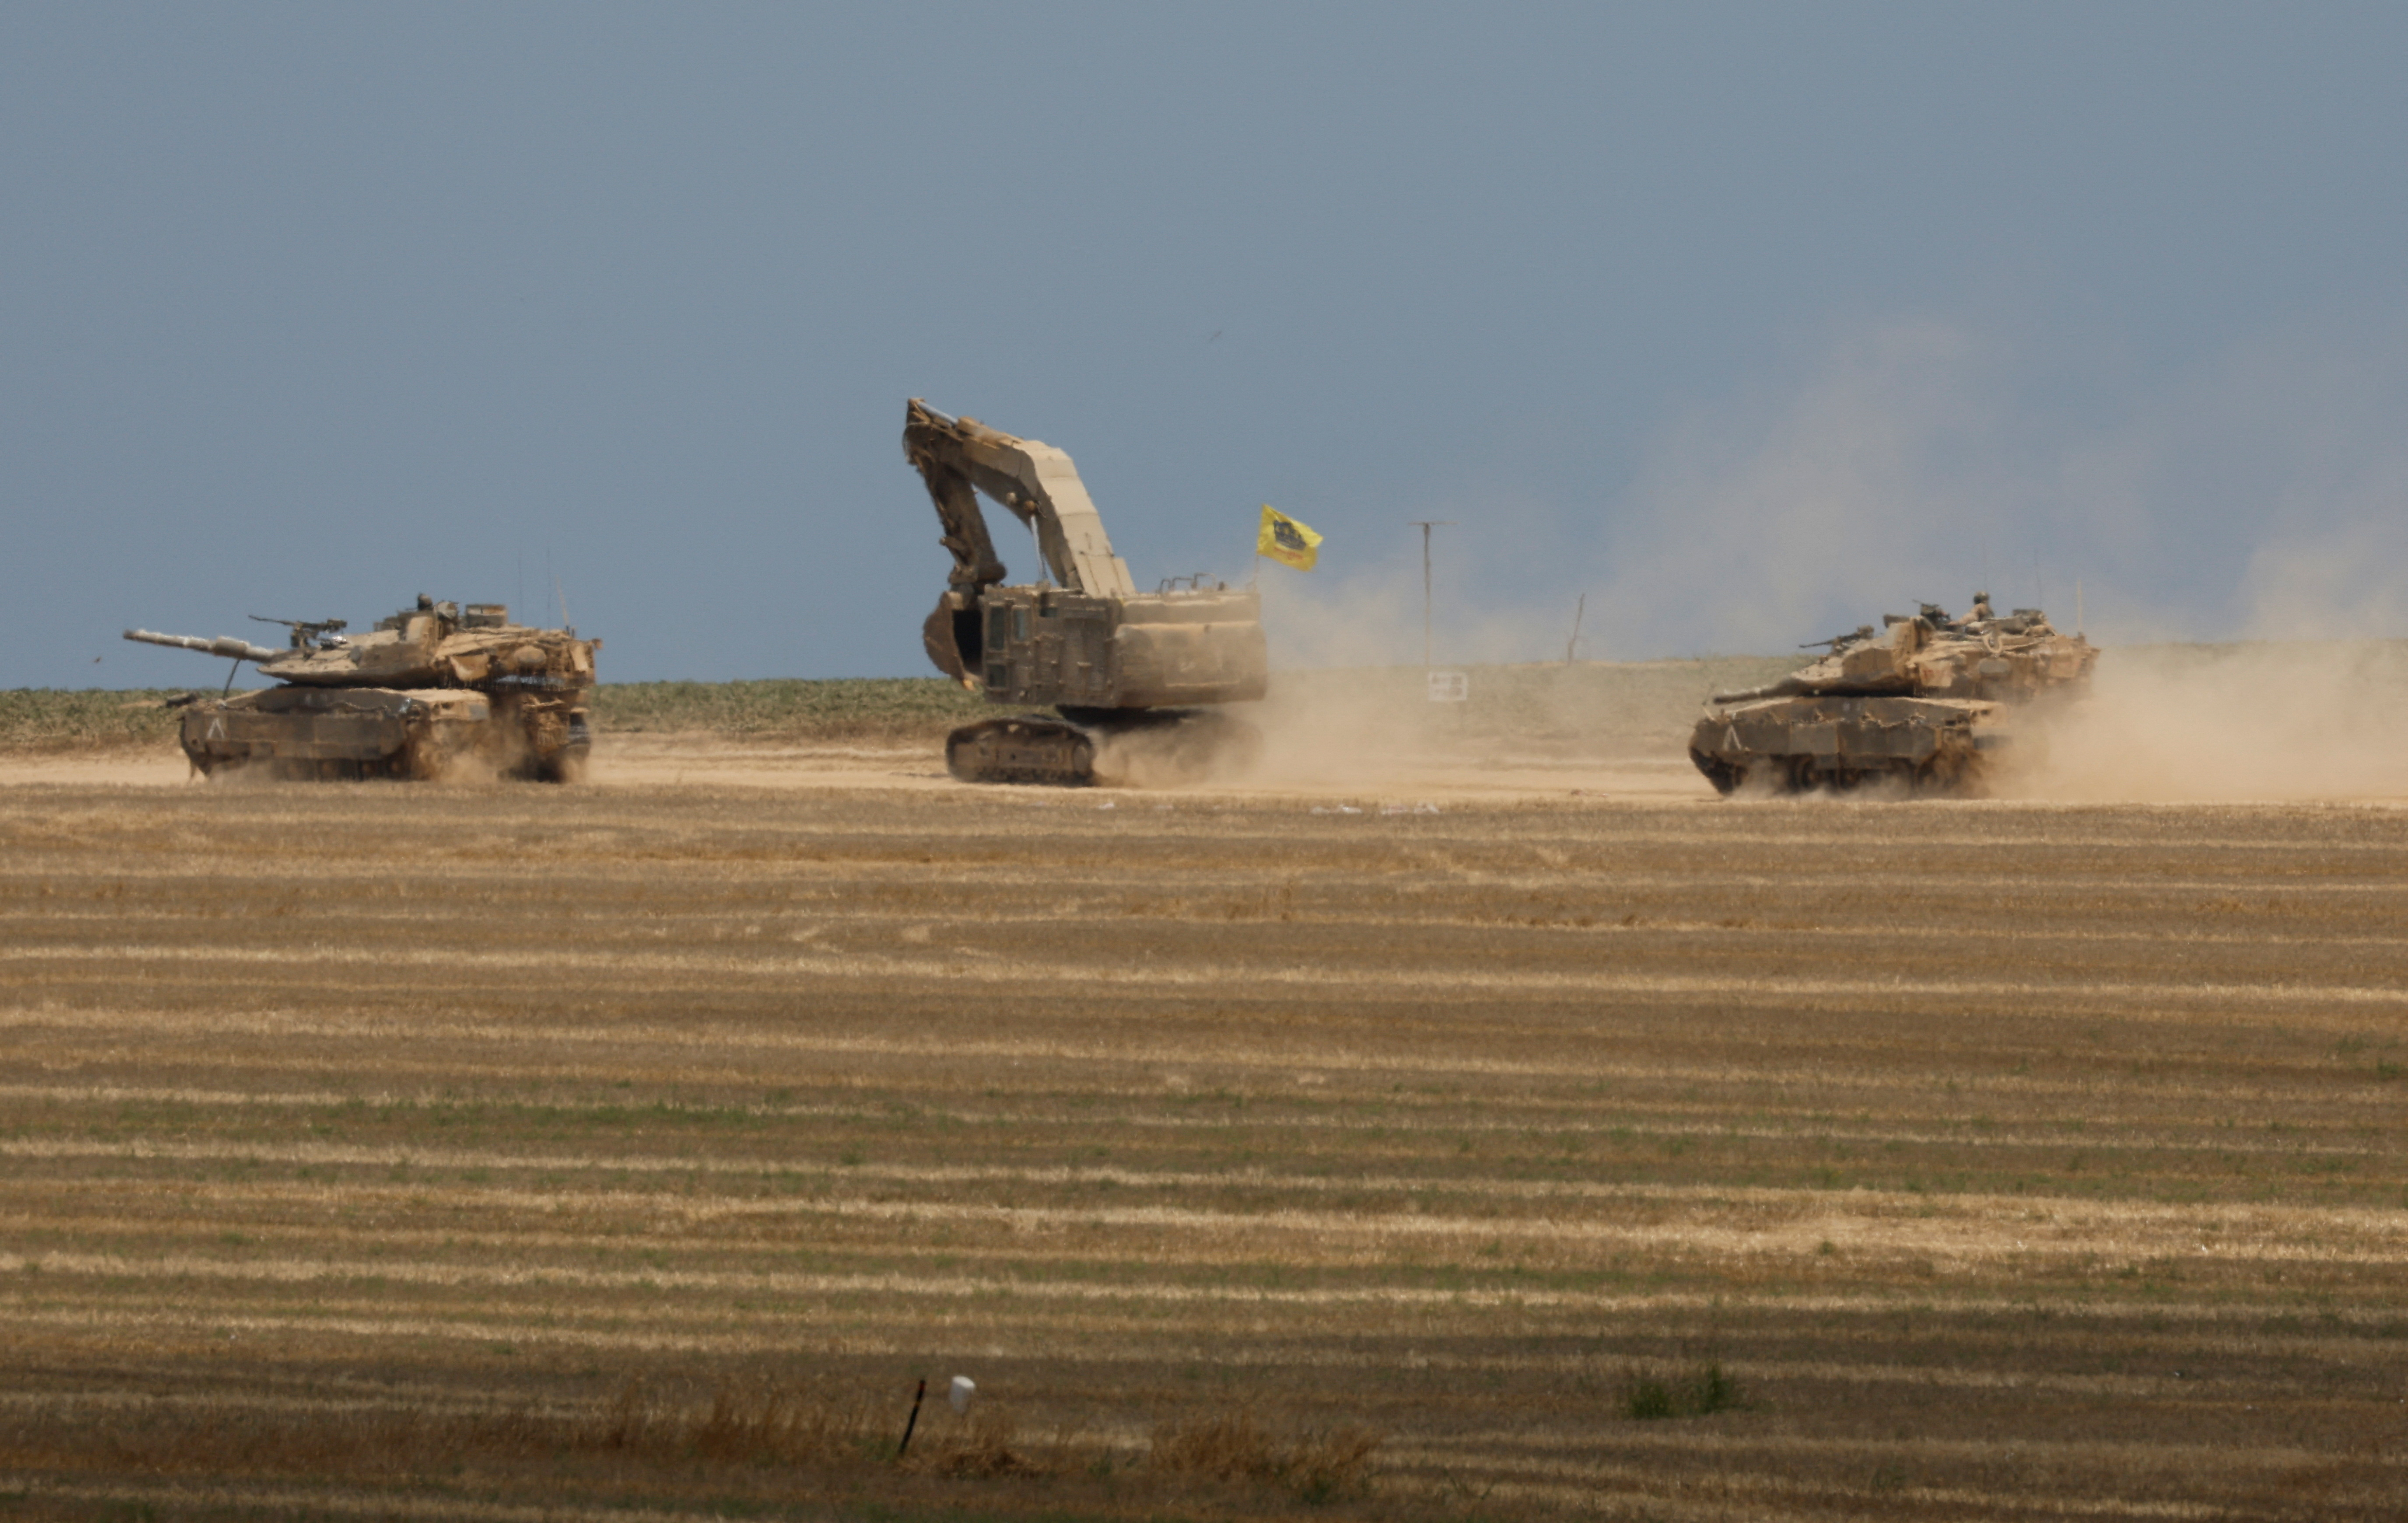
Israeli tanks push into Gaza's Rafah, as displaced civilians flee again
Israeli tanks manoeuvre, amid the ongoing conflict between Israel and the Palestinian Islamist group Hamas, near the Israel-Gaza Border May 14, 2024. REUTERS/Amir Cohen Israeli tanks forged deeper into eastern Rafah, reaching some residential districts on Tuesday, stepping up an offensive in the southern border city where more than a million people had been sheltering after being displaced in seven months of war.


Markets


Earnings


Talking Points
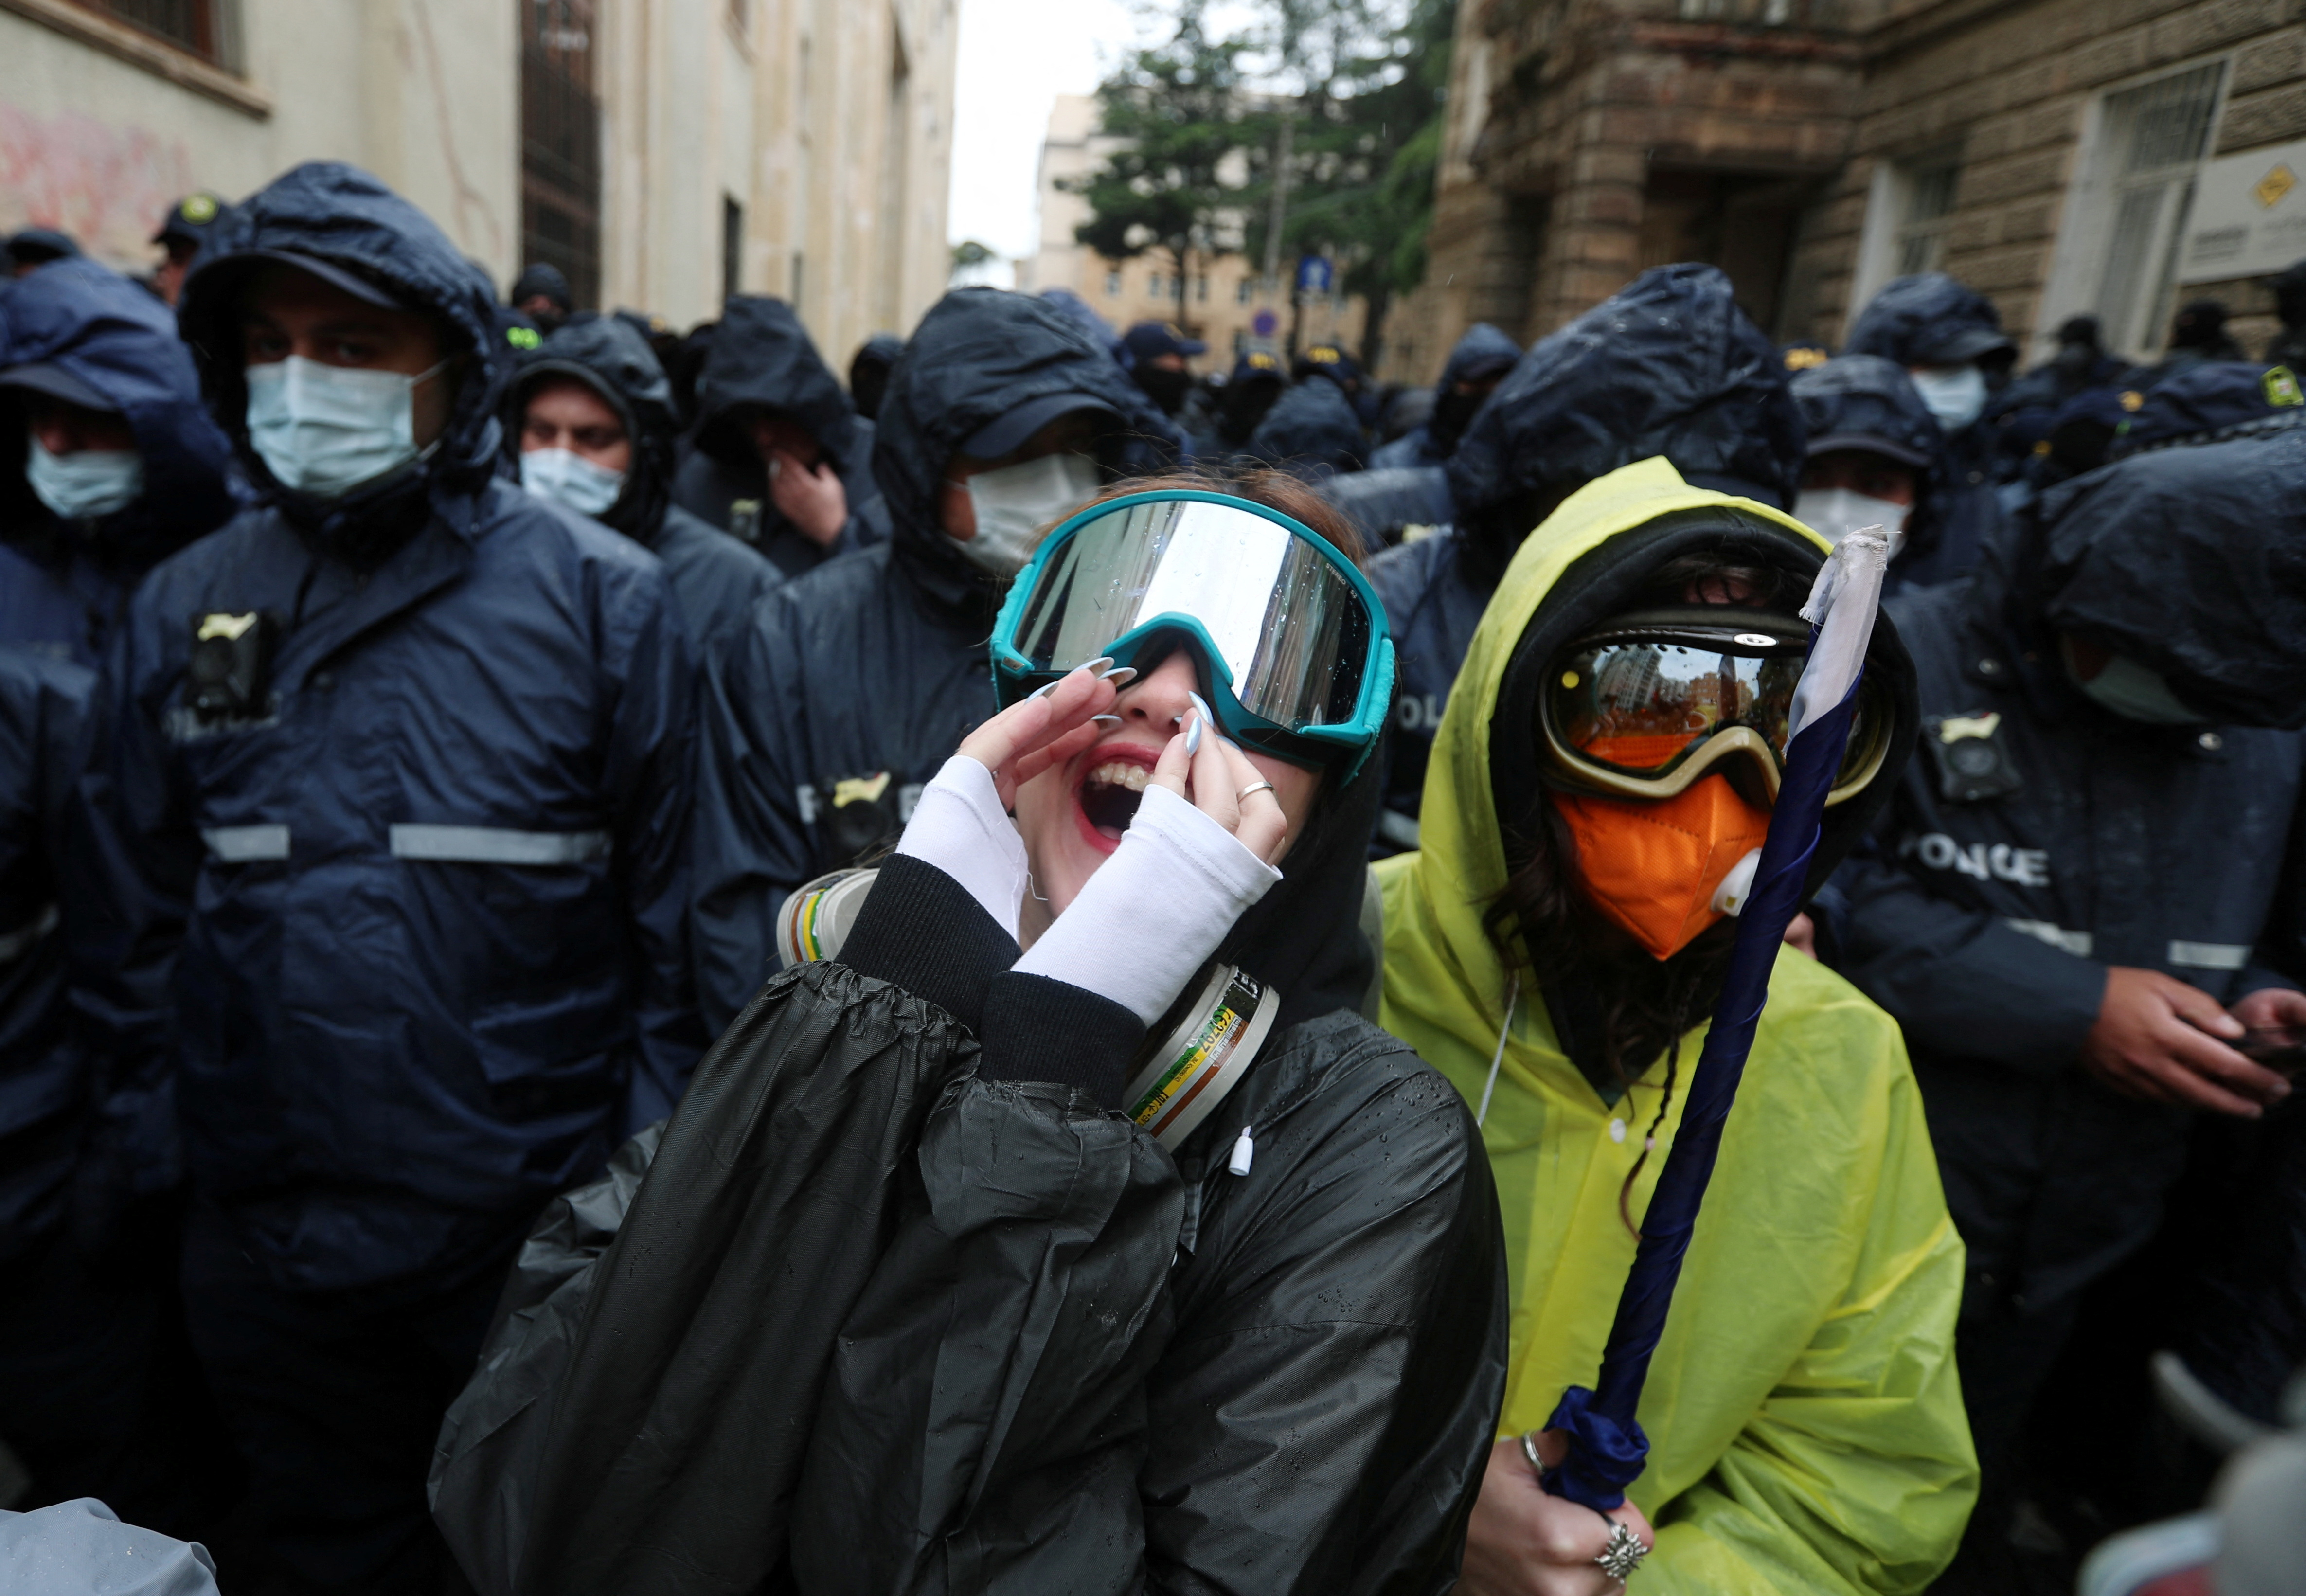

In picturesPro-Palestinian protests roil university campuses around the world
Students in both the US and Europe have been holding mostly peaceful demonstrations calling for an immediate permanent ceasefire and for schools to cut financial ties with companies they say are profiting from the oppression of Palestinians.