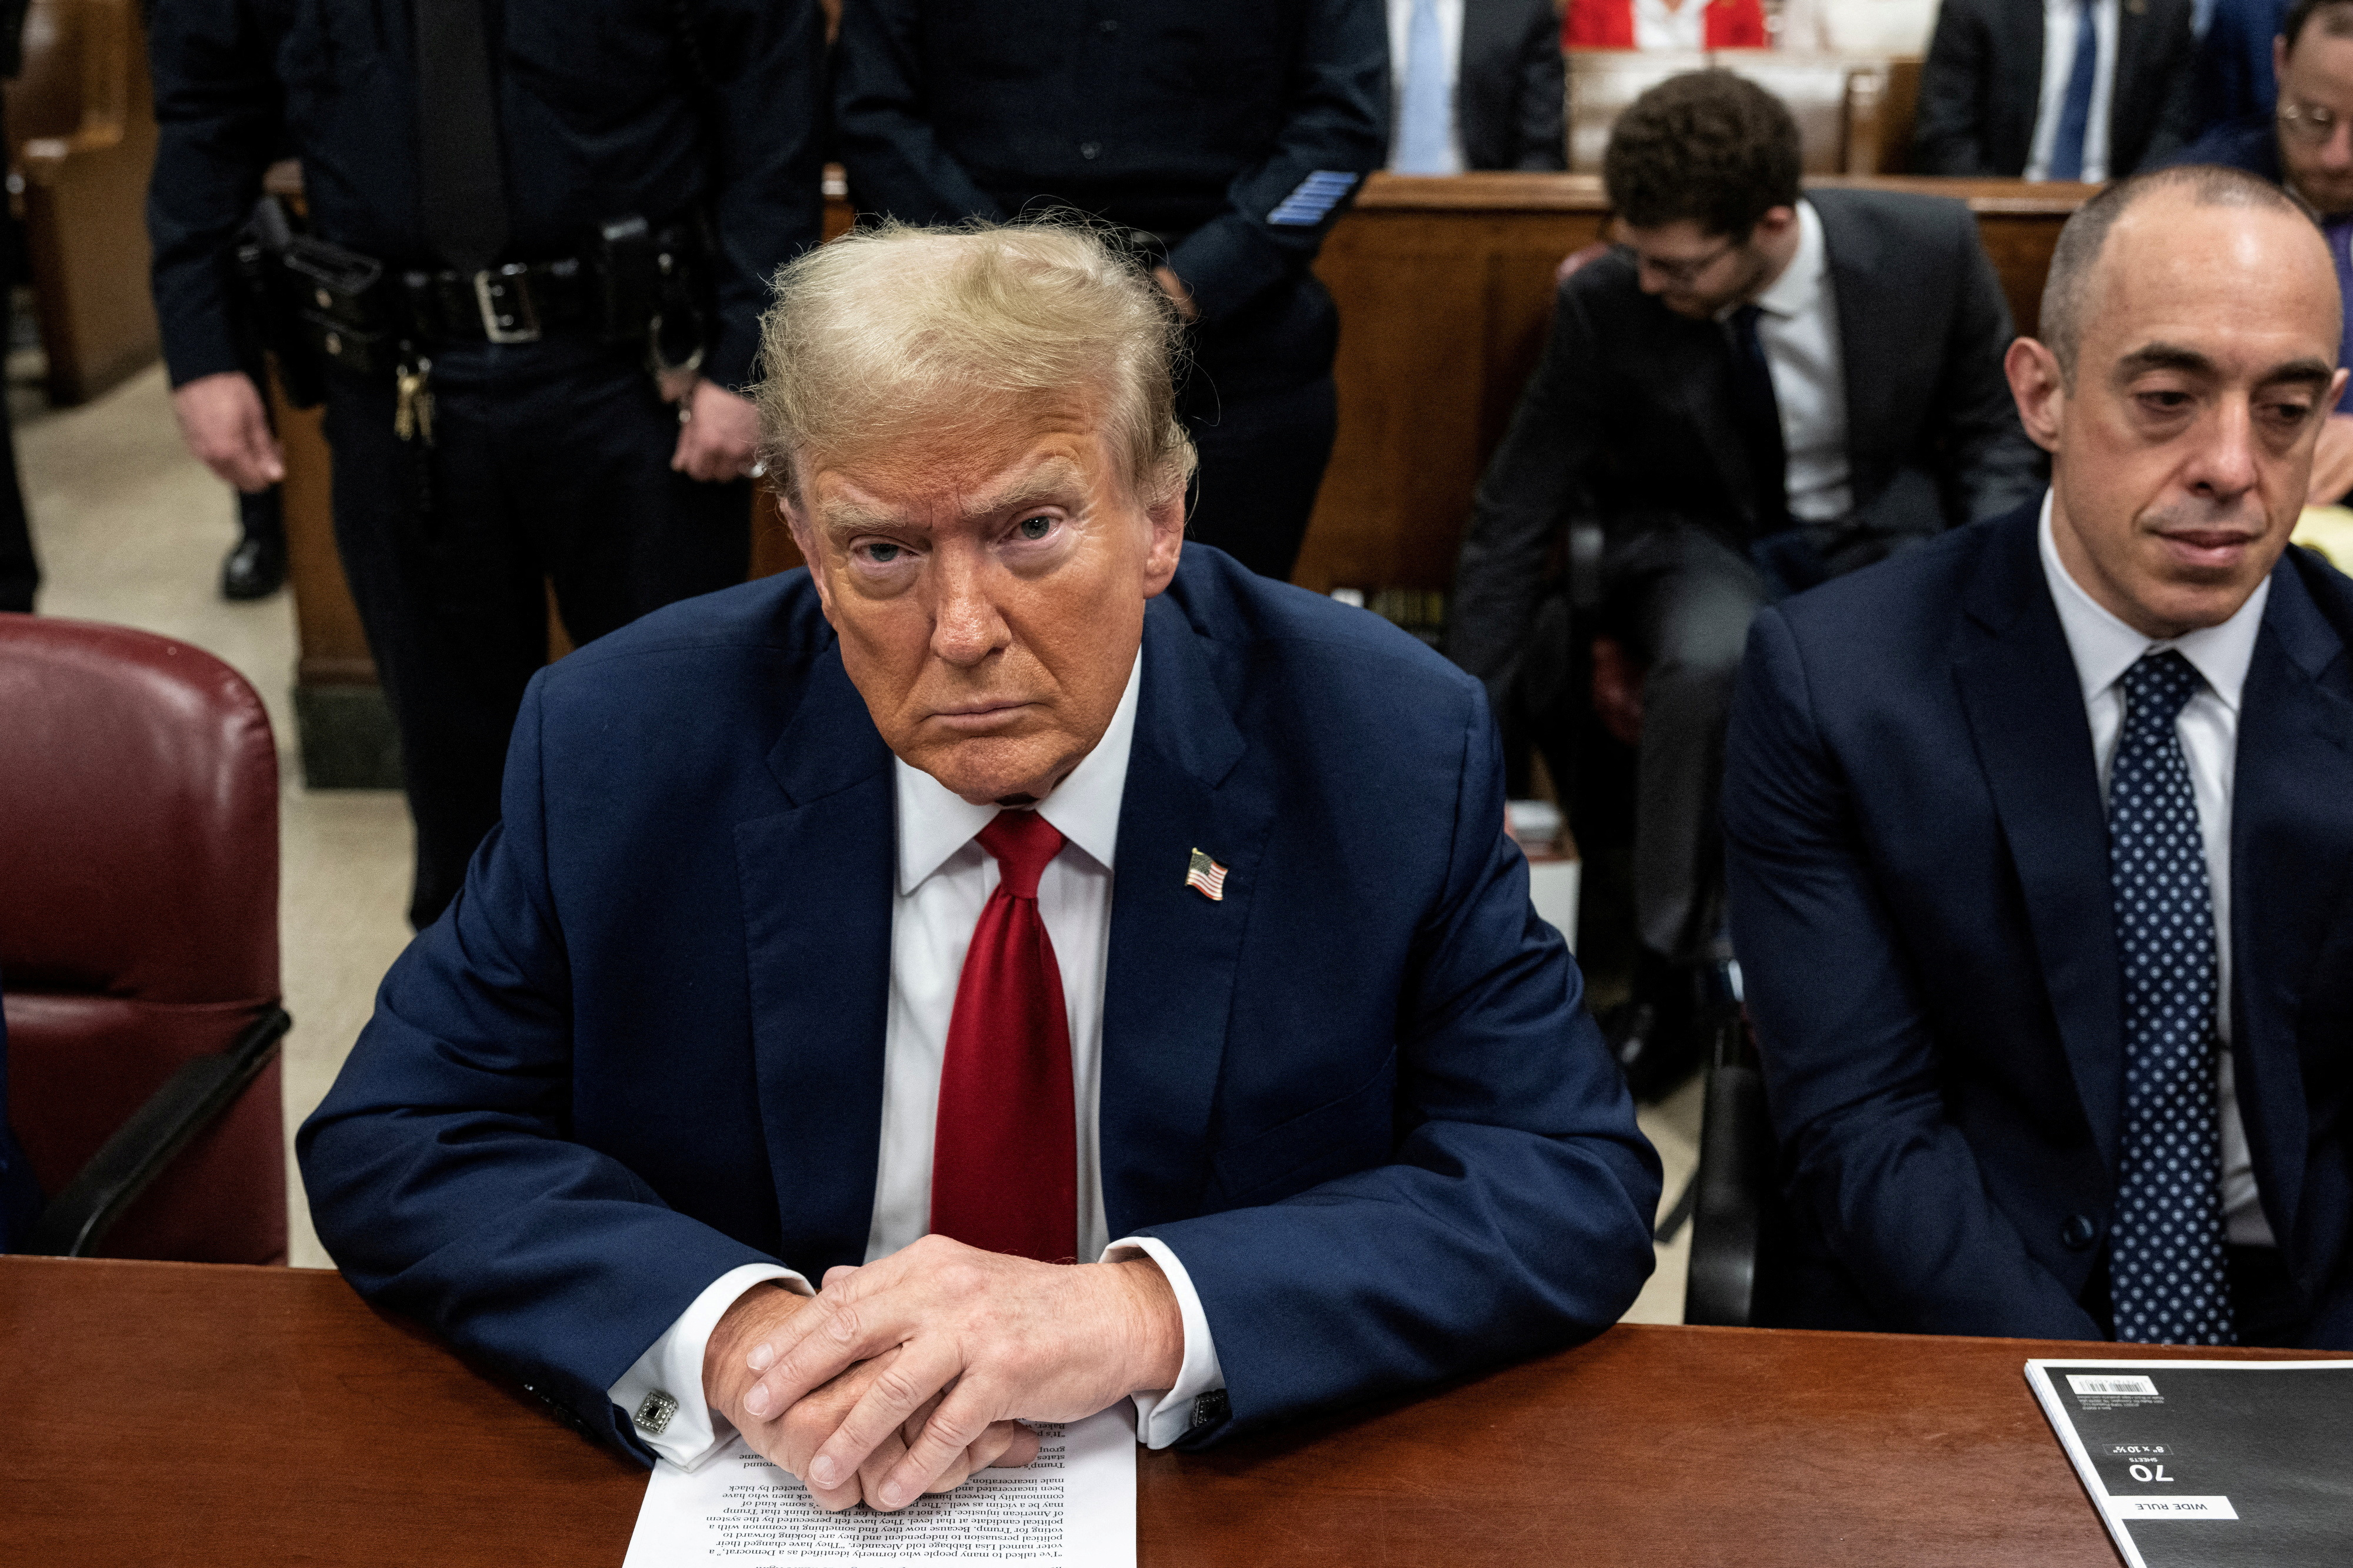
Quote For Halliburton Company HAL.N
sector: Energy ·
industry: Oil Related Services & Equipment ·
As of
3 Dec 2009
28.06USD
$28.06
3 Dec 2009
-3.07%
$28.06
--
14,428,377
$28.86
$27.98
$32.00
$12.80
1.49
12,719,494
News
Press Releases
Key Developments
Officers
| Name |
Current Position |
Compensation |
| Lesar, David |
Chairman of the Board, President, Chief Executive Officer |
17,876,200 |
| McCollum, Mark |
Chief Financial Officer, Executive Vice President |
2,420,900 |
| Probert, Timothy |
President of Drilling and Evaluation Division and Corporate Development |
-- |
Key Ratios and Statistics
| Share Related Items |
| Market Cap (Mil.) |
$25,308.11 |
| Shares Outstanding (Mil.) |
901.93 |
| Float (Mil.) |
894.30 |
| |
| Dividend Information |
| Yield % |
1.28 |
| Annual Dividend ($ USD) |
0.36 |
| Payout Ratio(TTM) % |
19.22 |
| |
| Financial Strength |
| Quick Ratio |
2.01 |
| Current Ratio |
3.98 |
| LT Debt/Equity |
53.49 |
| Total Debt/Equity |
53.49 |
| |
| Valuation Ratios |
| Price/Earnings(TTM) |
14.98 |
| Price/Sales(TTM) |
1.59 |
| Price/Book(TTM) |
2.96 |
| Price/Cash Flow(TTM) |
9.94 |
| |
|
| Per Share Data |
| Earnings(TTM) |
$1.88 |
| Sales(TTM) |
$17.67 |
| Book Value(MRQ) |
$9.48 |
| Cash Flow(TTM) |
$2.83 |
| Cash(MRQ) |
$3.54 |
|
| Management Effectiveness |
| Return on Equity(TTM) |
21.07 |
| Return on Assets(TTM) |
11.05 |
| Return on Investment(TTM) |
13.14 |
| |
|
| Margins |
| Gross Margin(TTM) % |
18.09 |
| Operating Margin(TTM) % |
17.16 |
| Profit Margin(TTM) % |
10.48 |
|
| |
|
UK
US
- Europe
- Asia
- UK Most Actives