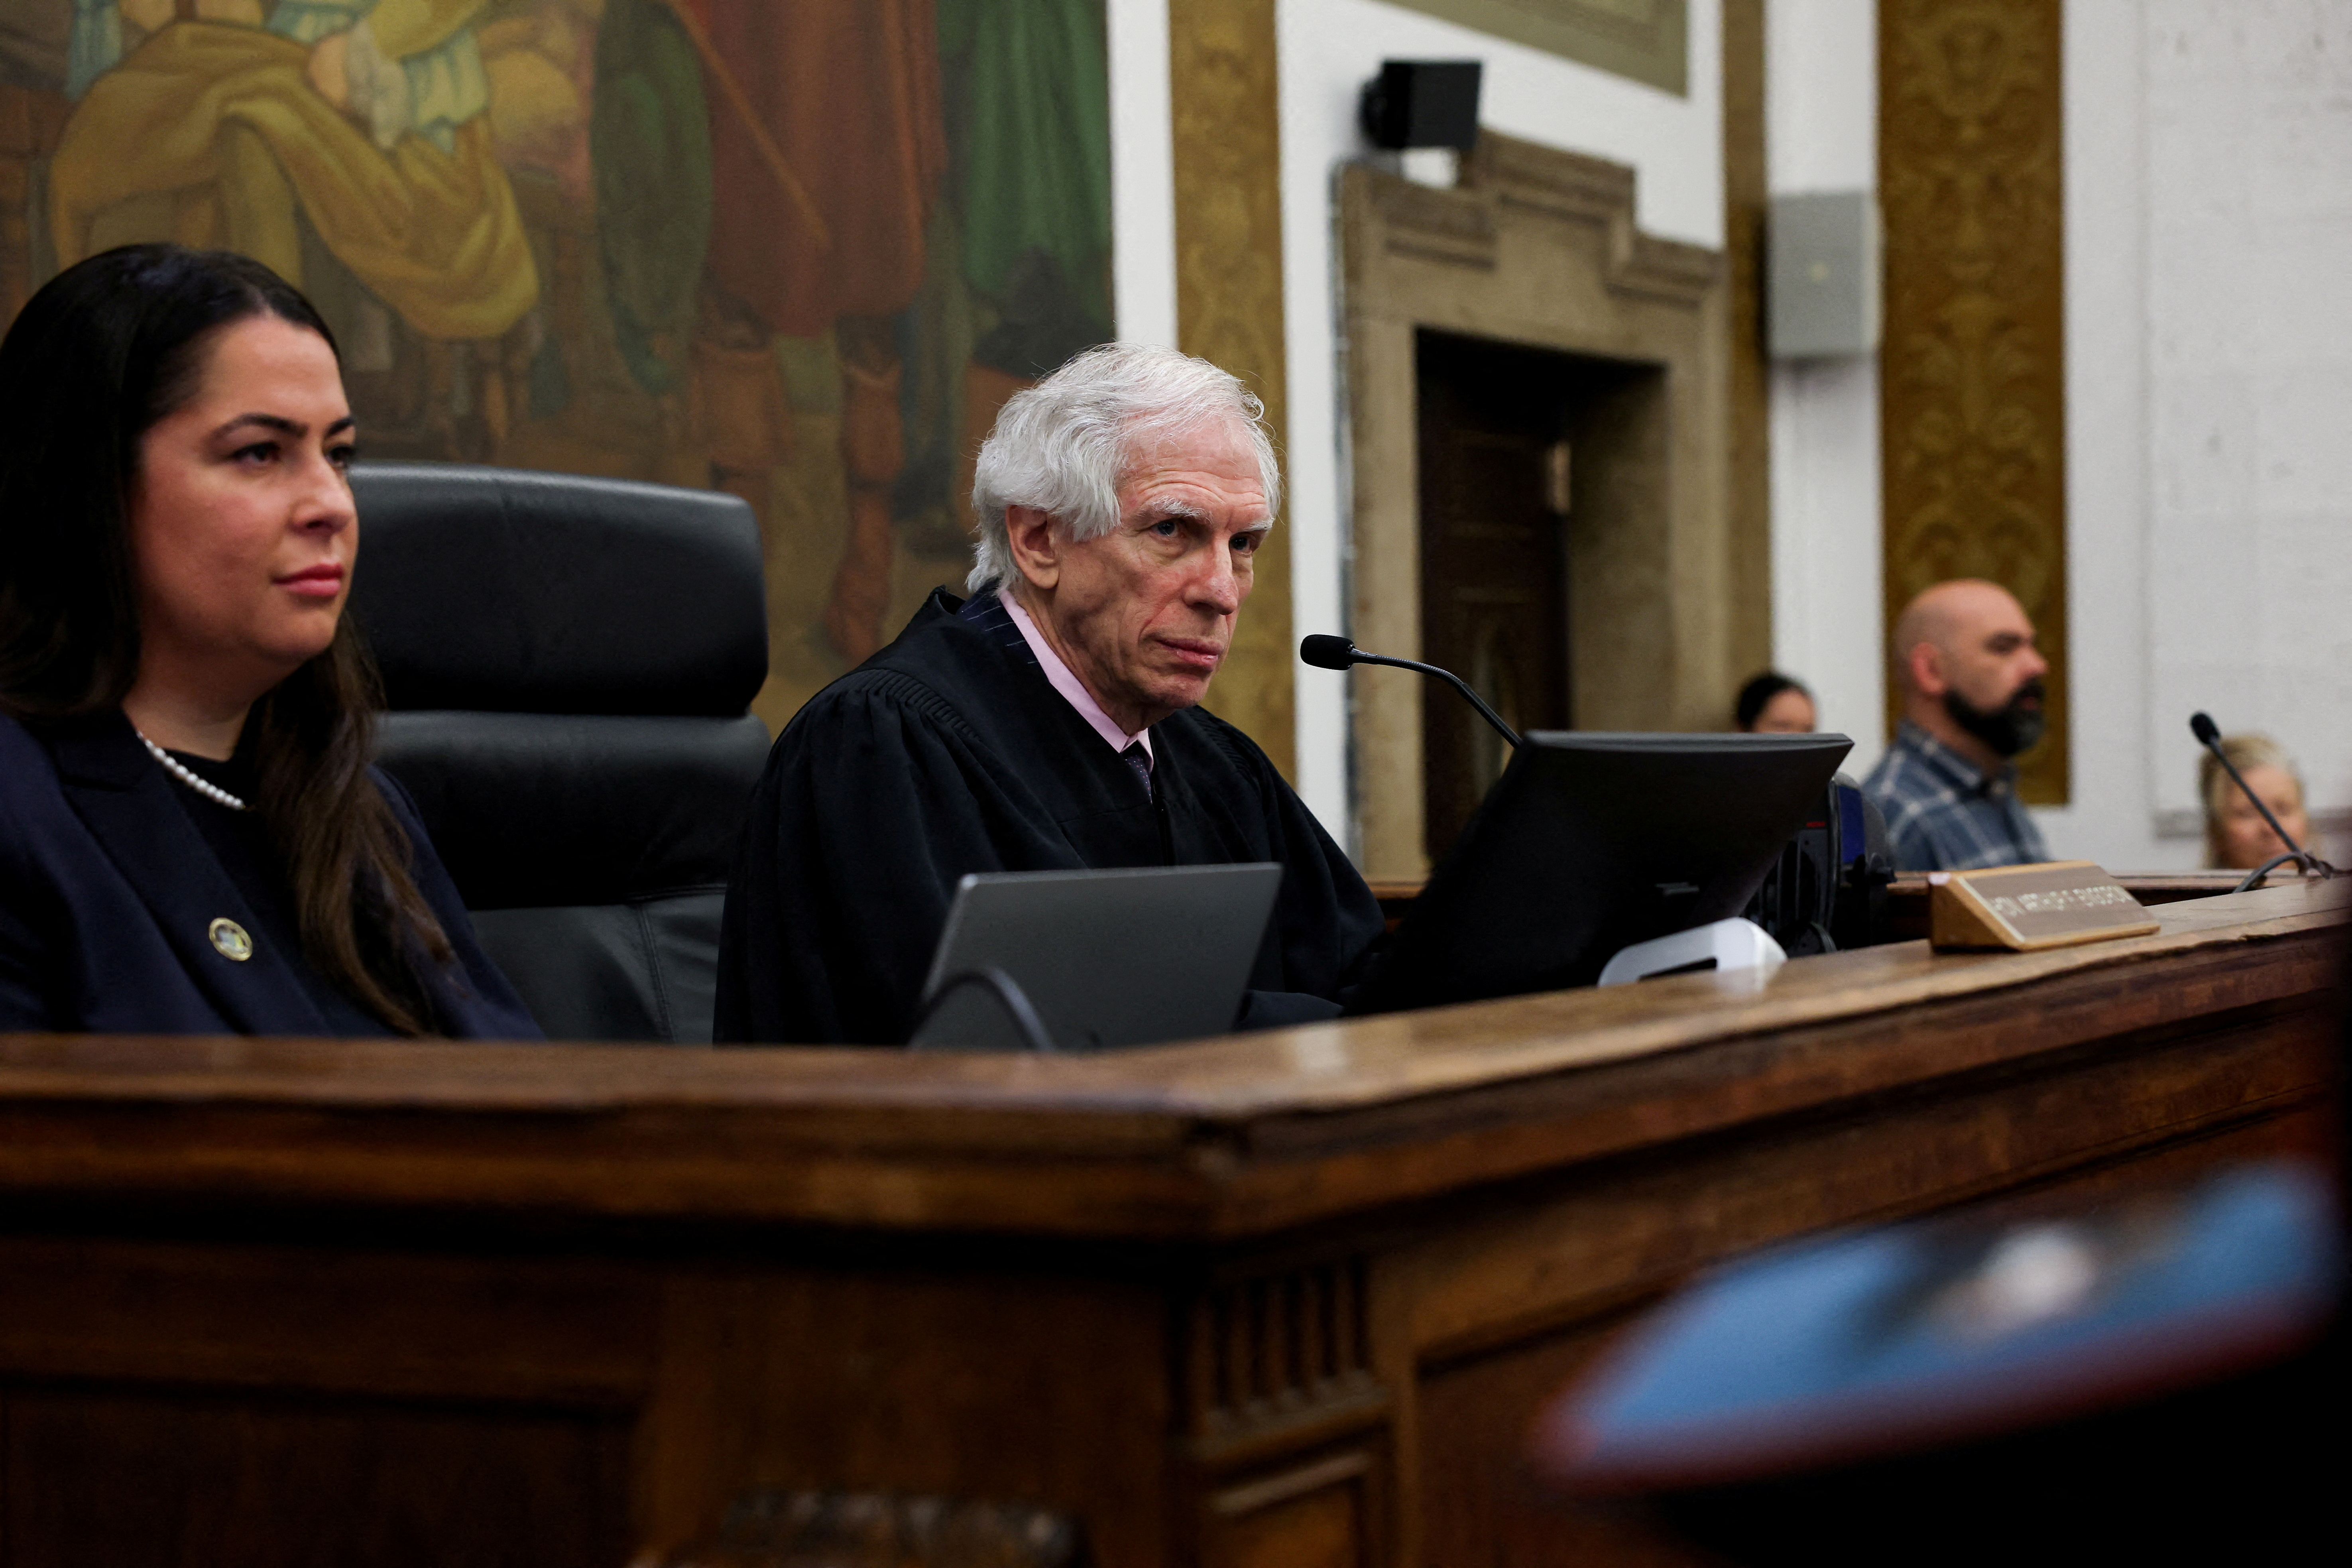
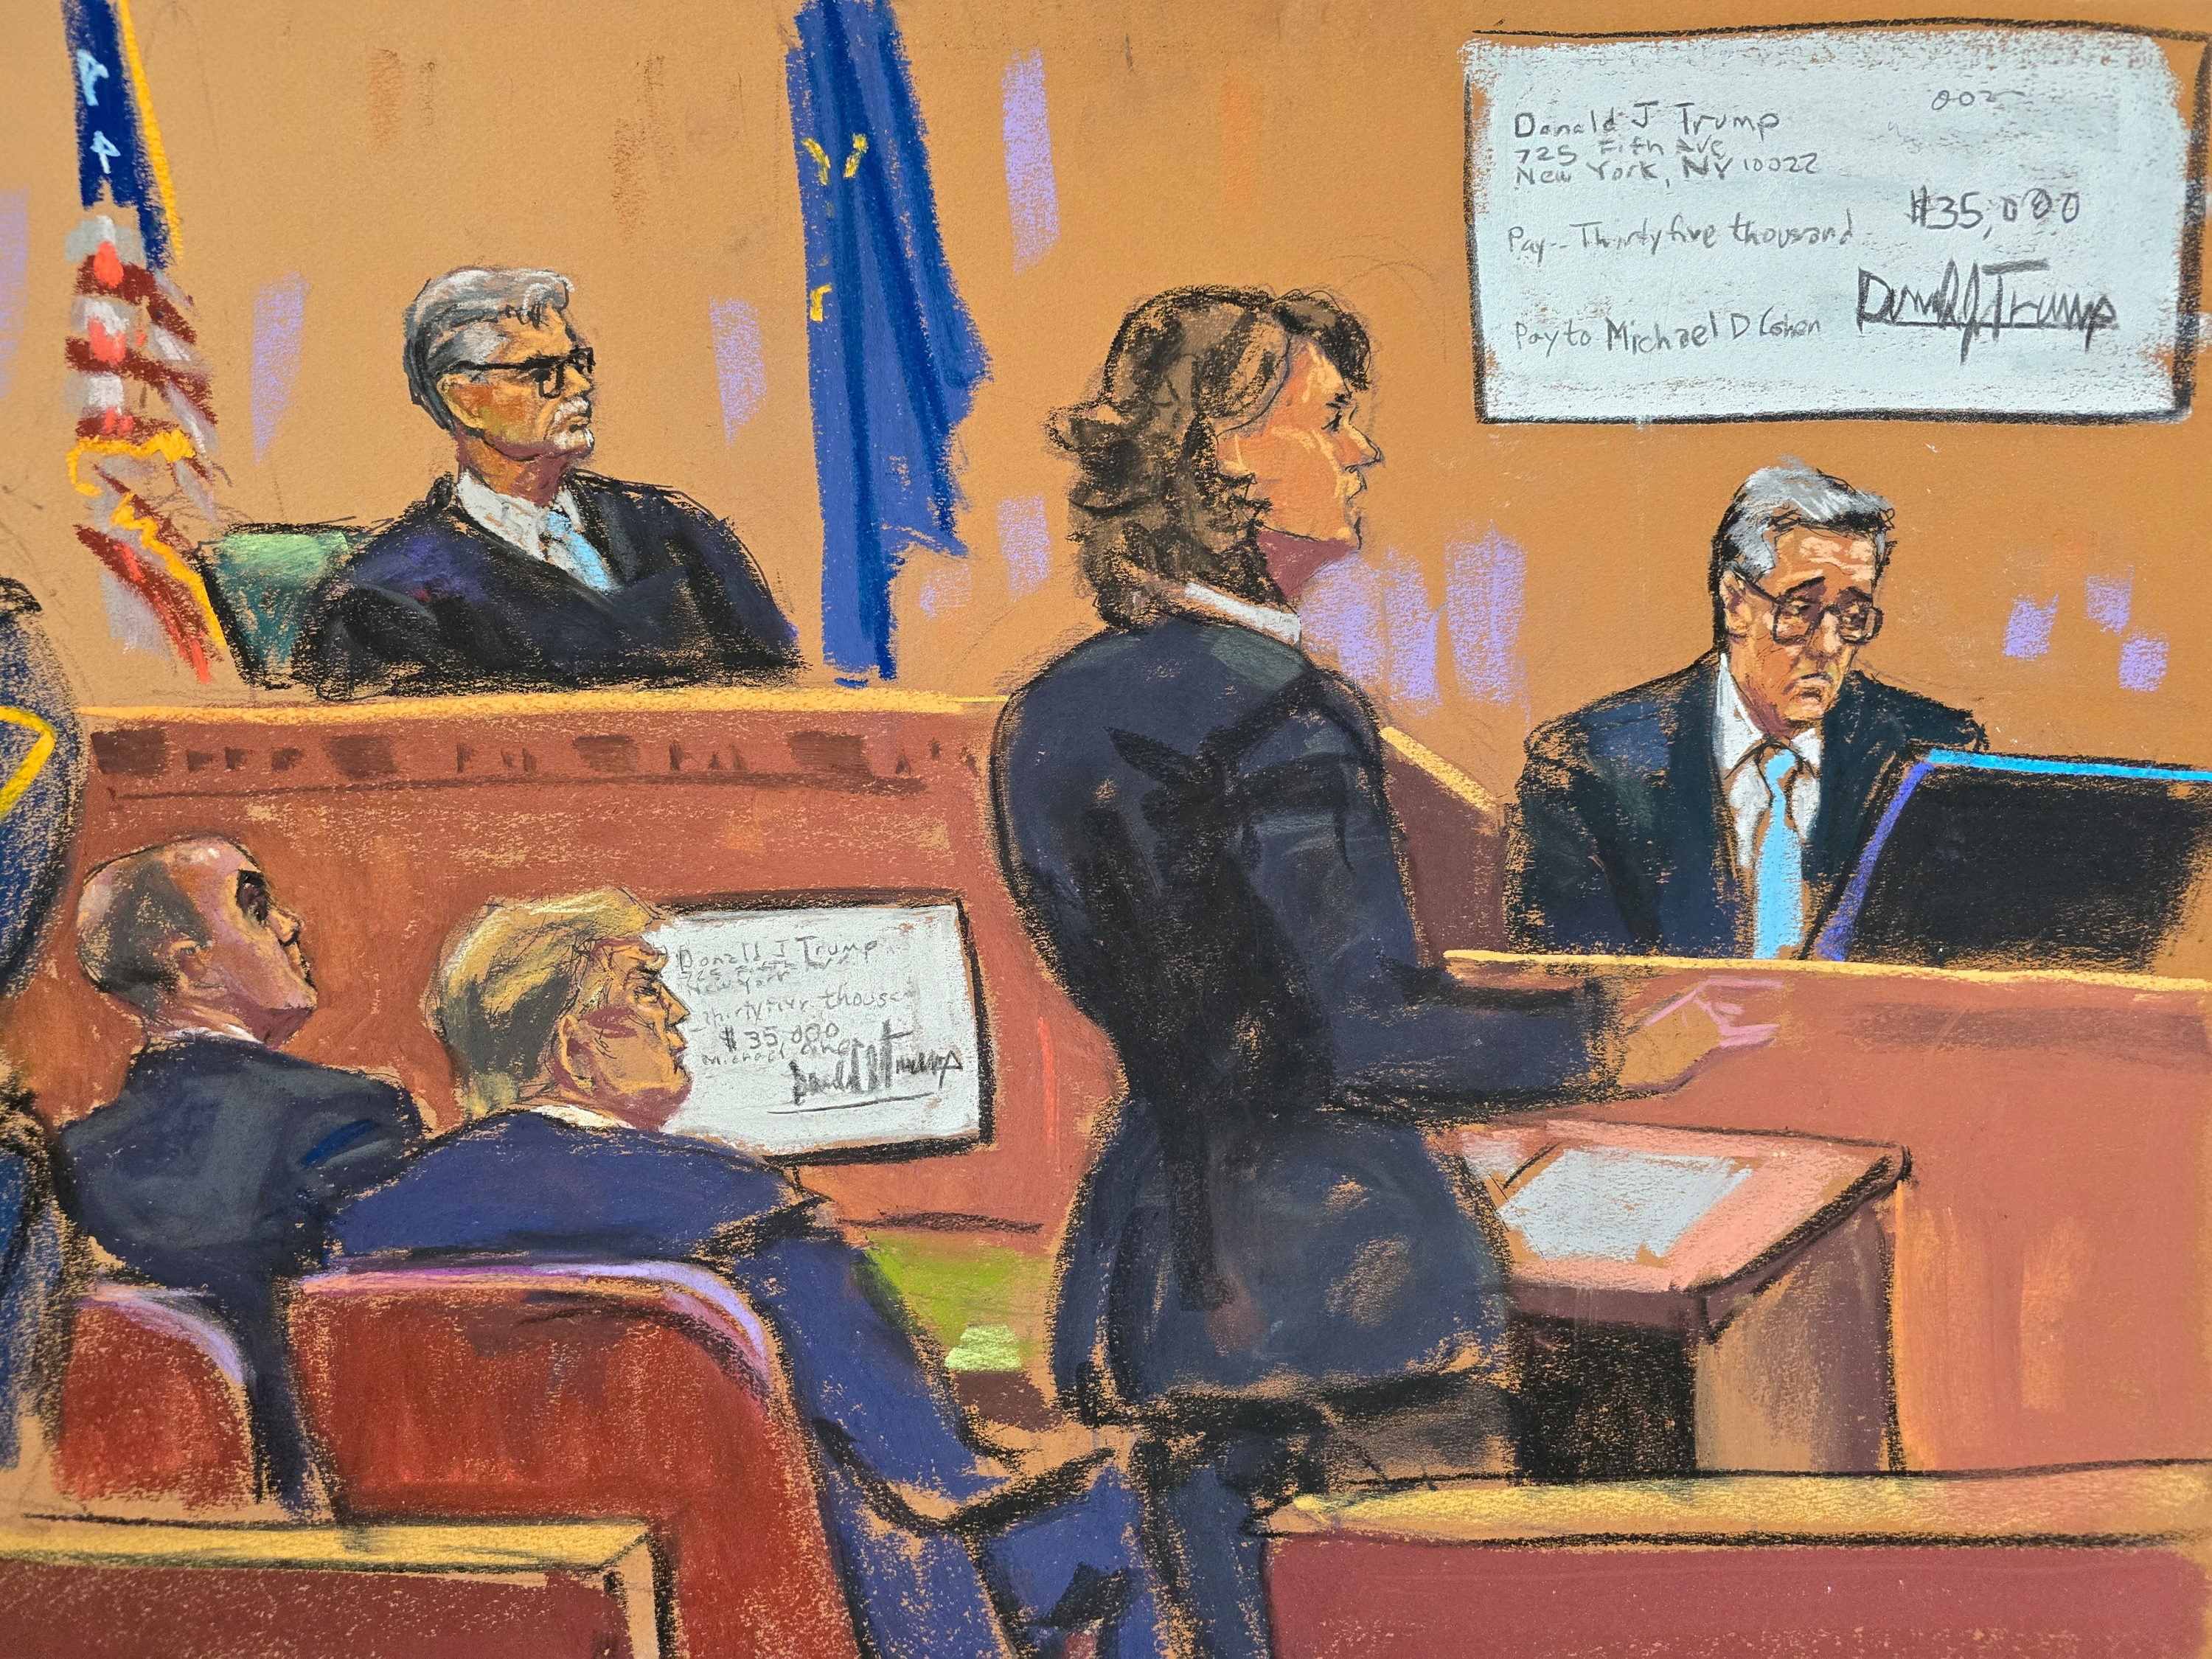
Trump’s attacks on his trial judges trigger widespread calls for violence
Judge Arthur Engoron attends the closing arguments in the Trump Organization civil fraud trial at New York State Supreme Court. REUTERS/Shannon Stapleton Special Report: Donald Trump’s attacks on judges and prosecutors in his trials as corrupt tools of the Biden administration are inspiring calls for violence against the jurists by his followers.
Markets


Talking Points


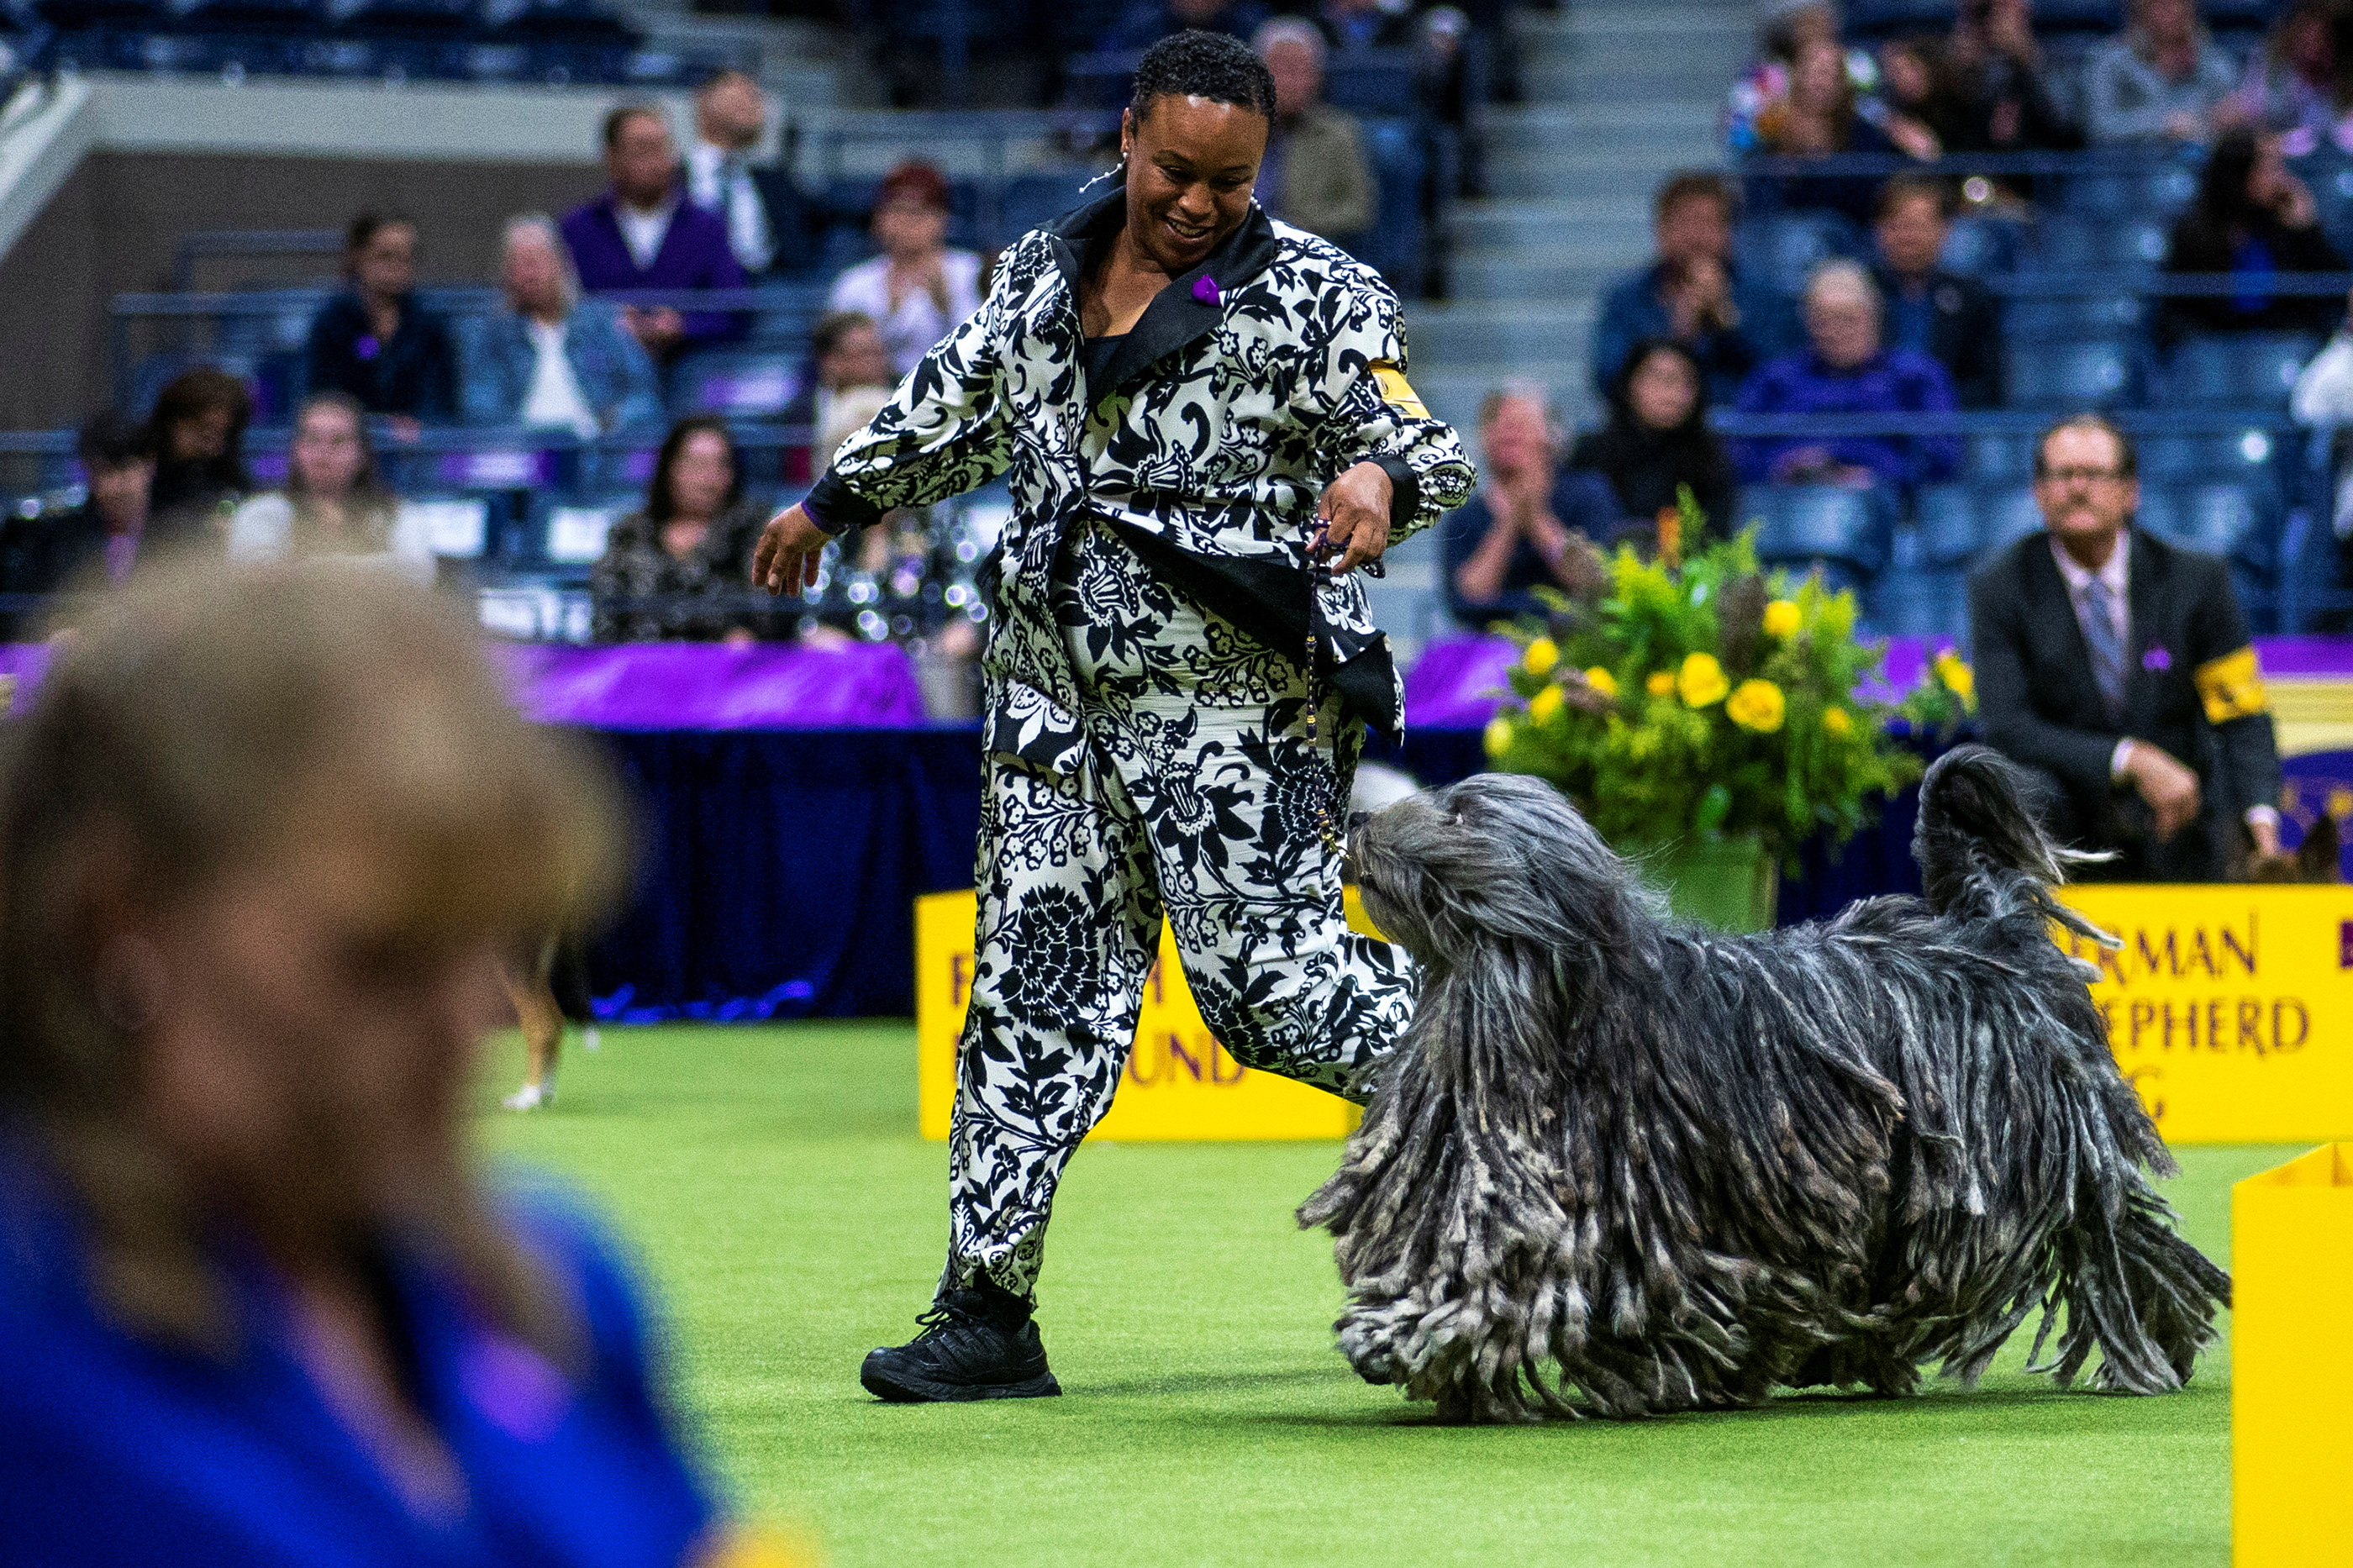
In PicturesScenes from the Westminster Dog Show
The 148th Westminster Kennel Club Dog Show gets underway at the USTA Billie Jean King National Tennis Center in New York City.