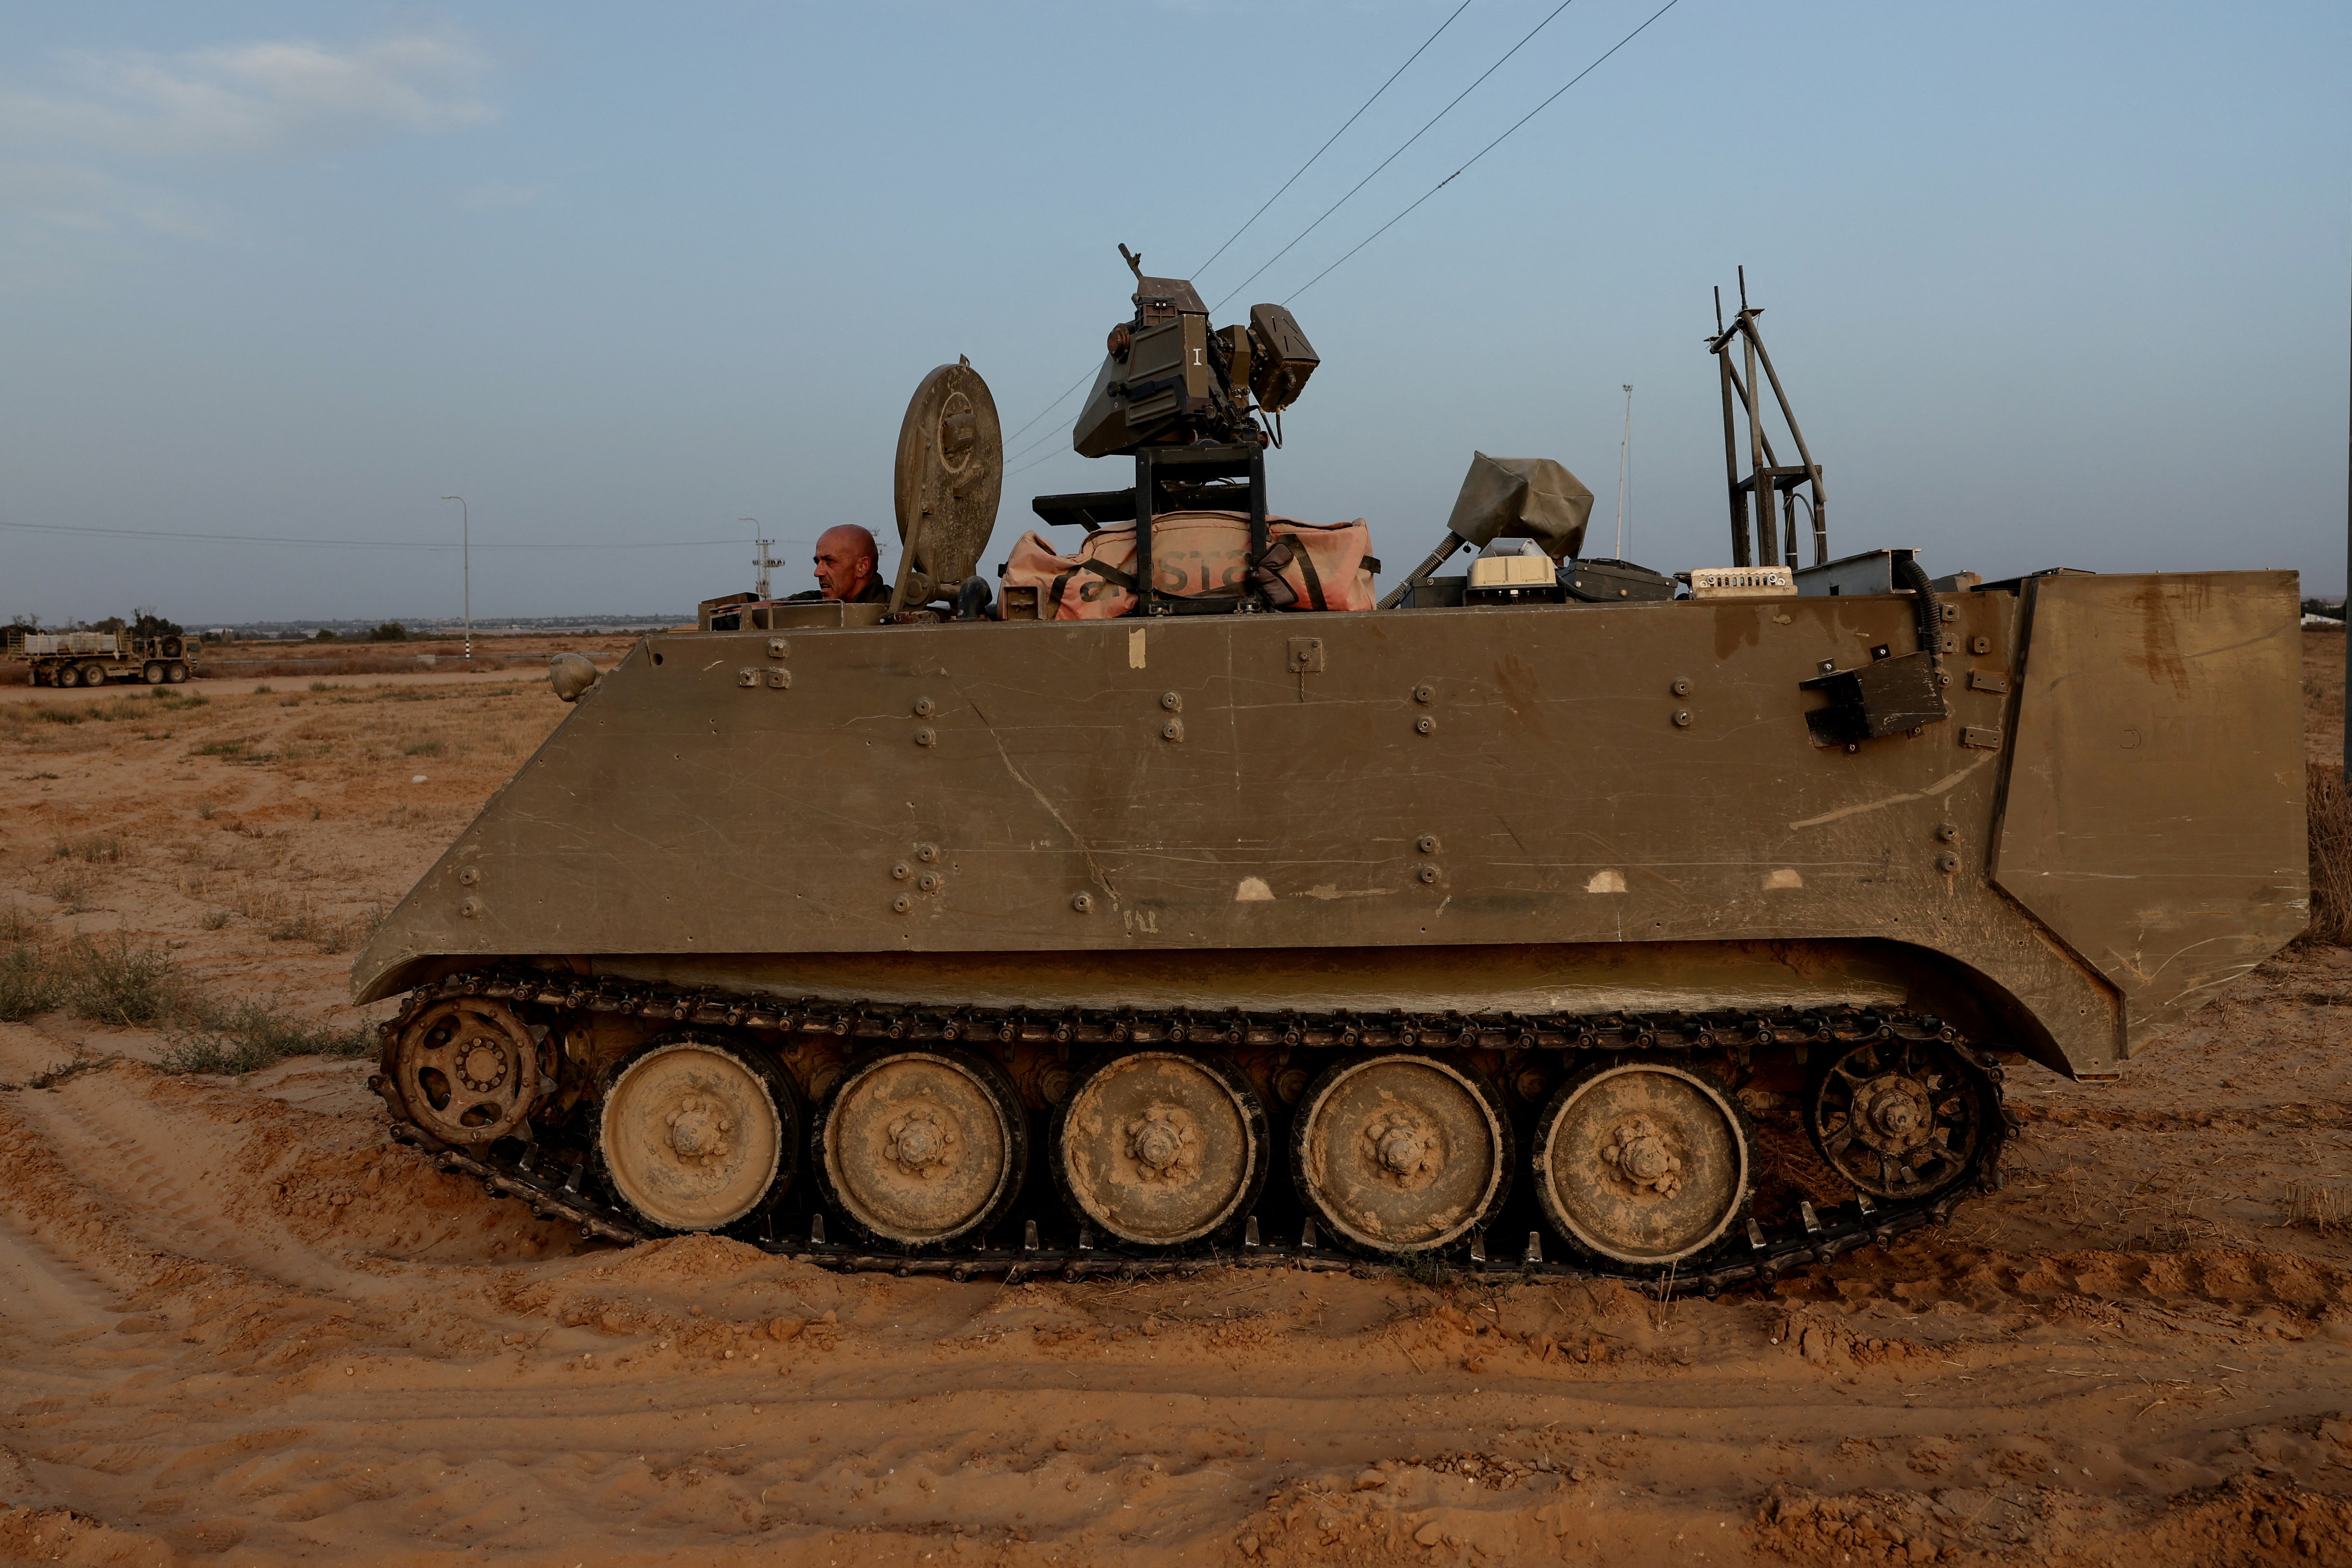
Israel pushes into new parts of northern Gaza, recovers another slain hostage
Kerem Shalom, Israel, May 17, 2024. REUTERS/Shannon Stapleton Fighters attacked Israeli forces in Jabalia and Rafah with anti-tank rockets, mortar bombs, and explosive devices.
World News
Talking Points
The Wider Image
Age no barrier for Italy's 90-year-old sprint queen

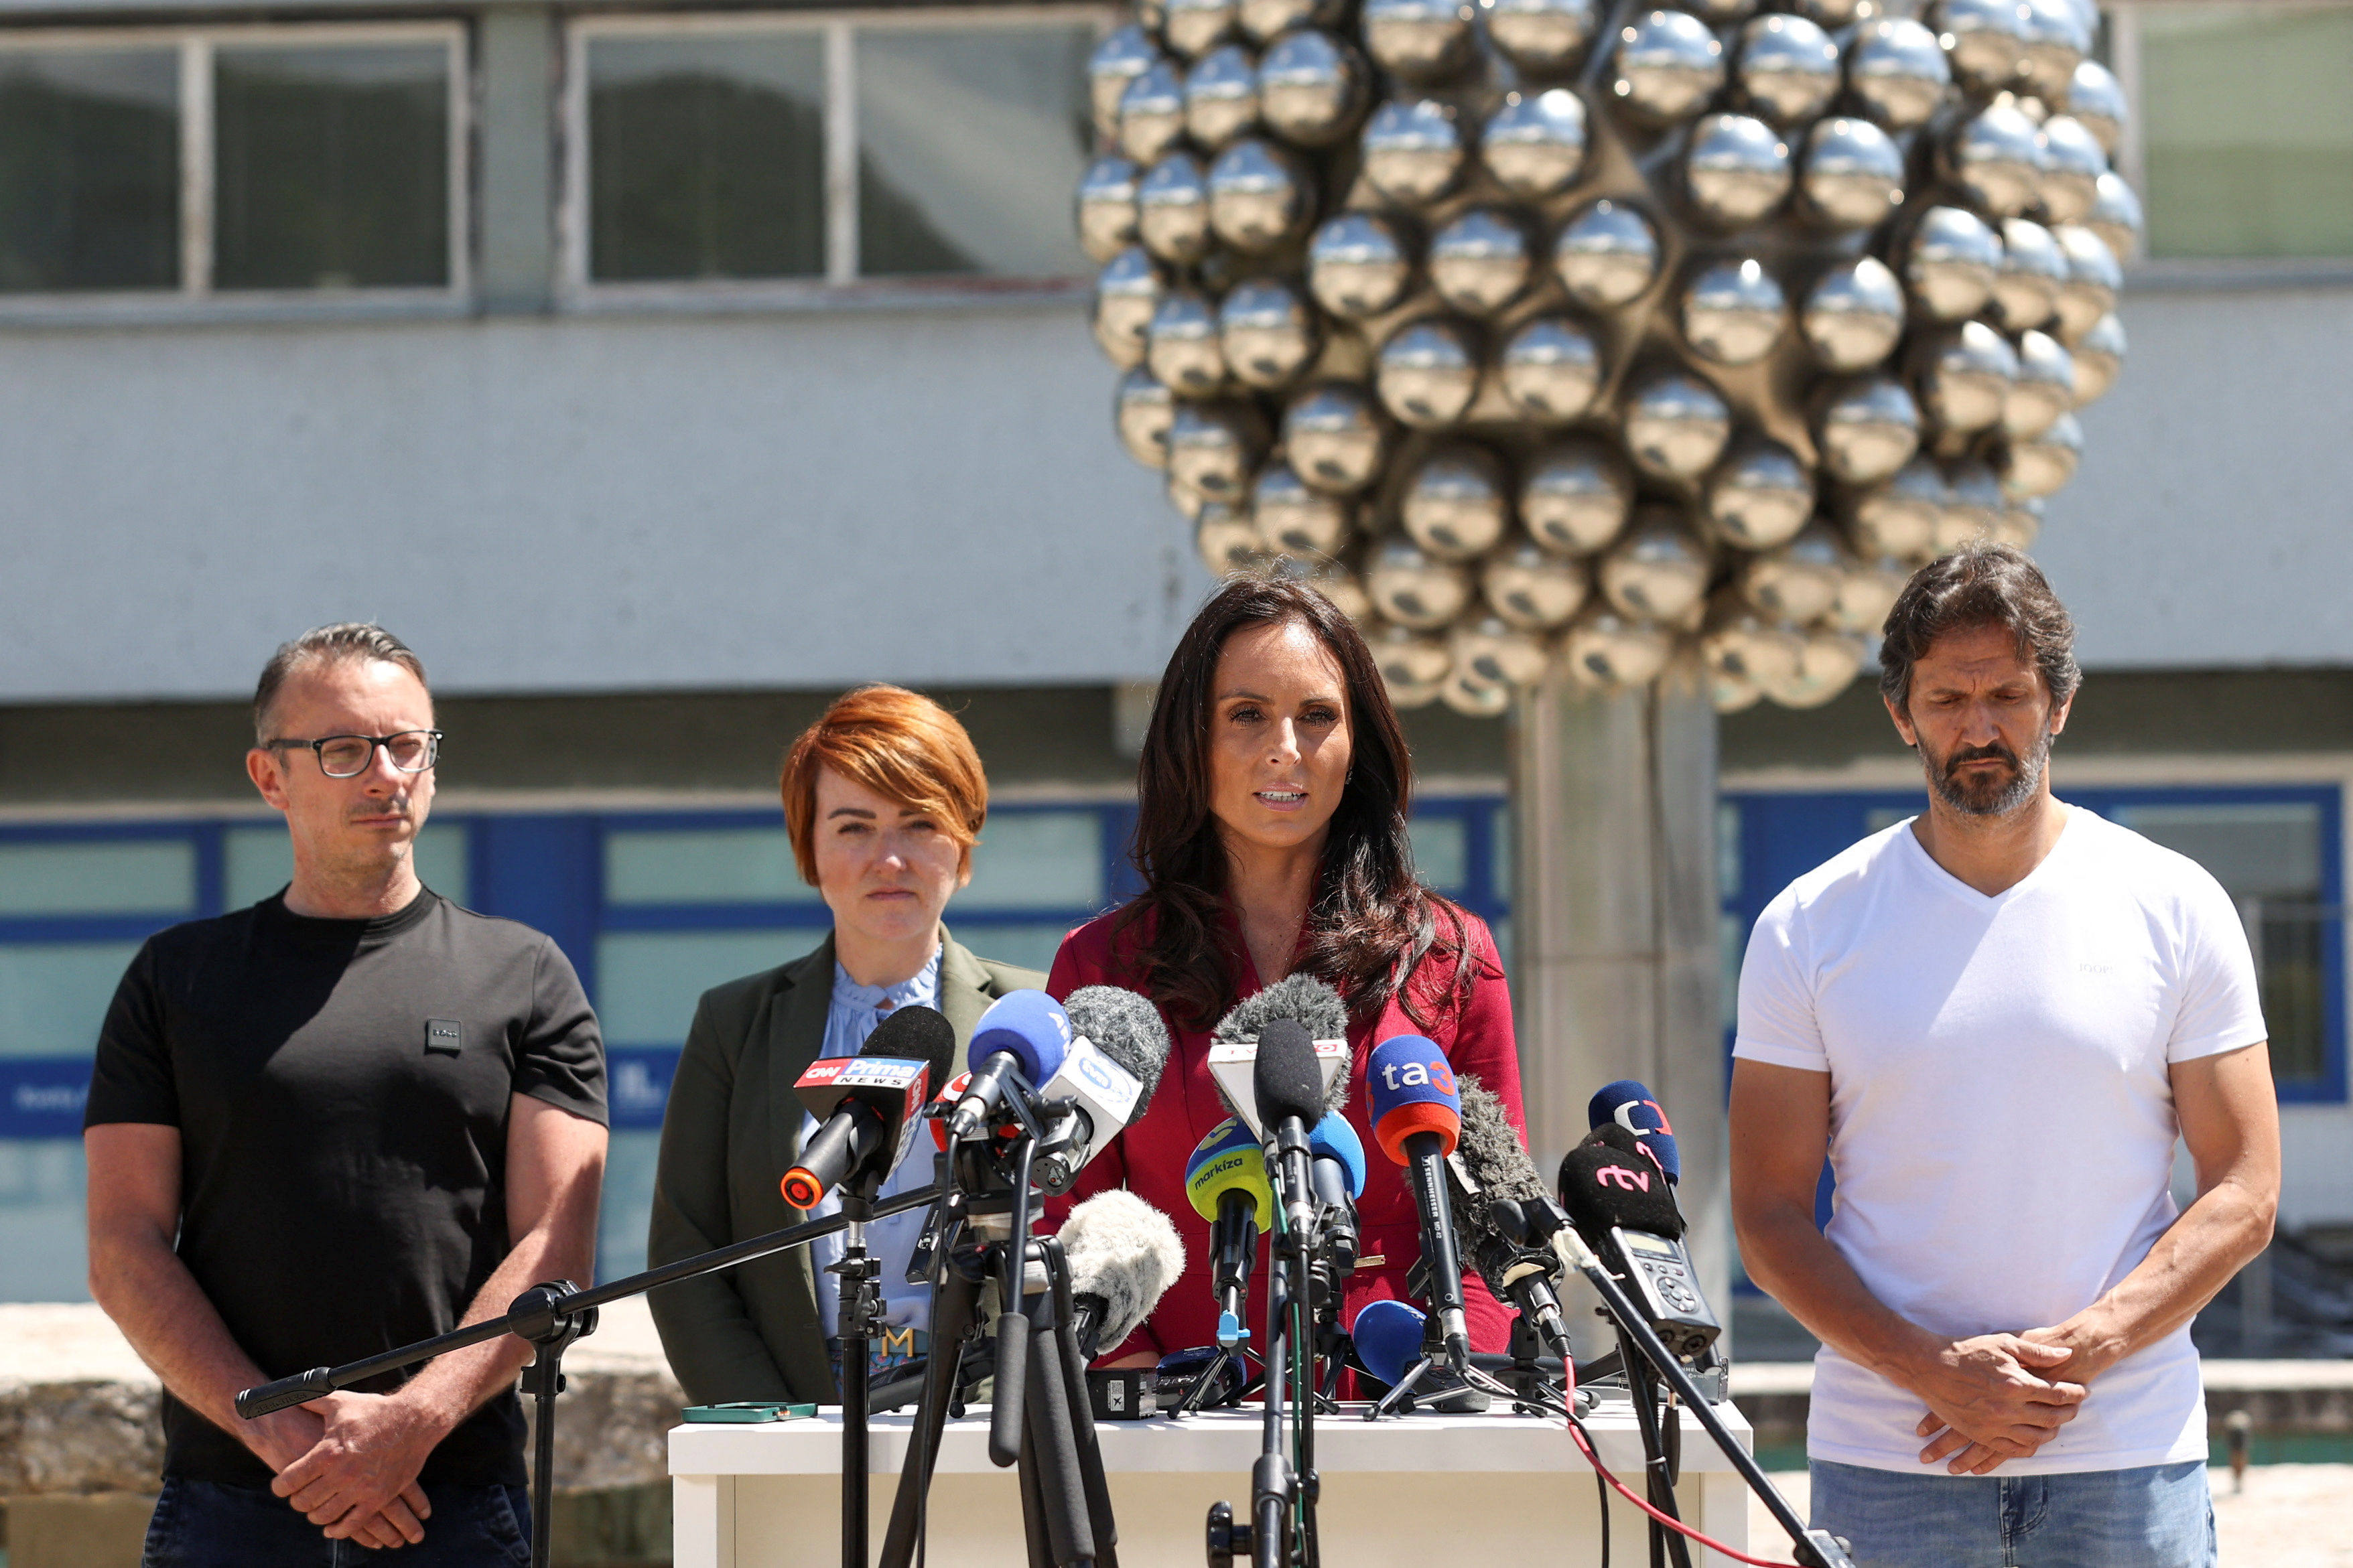


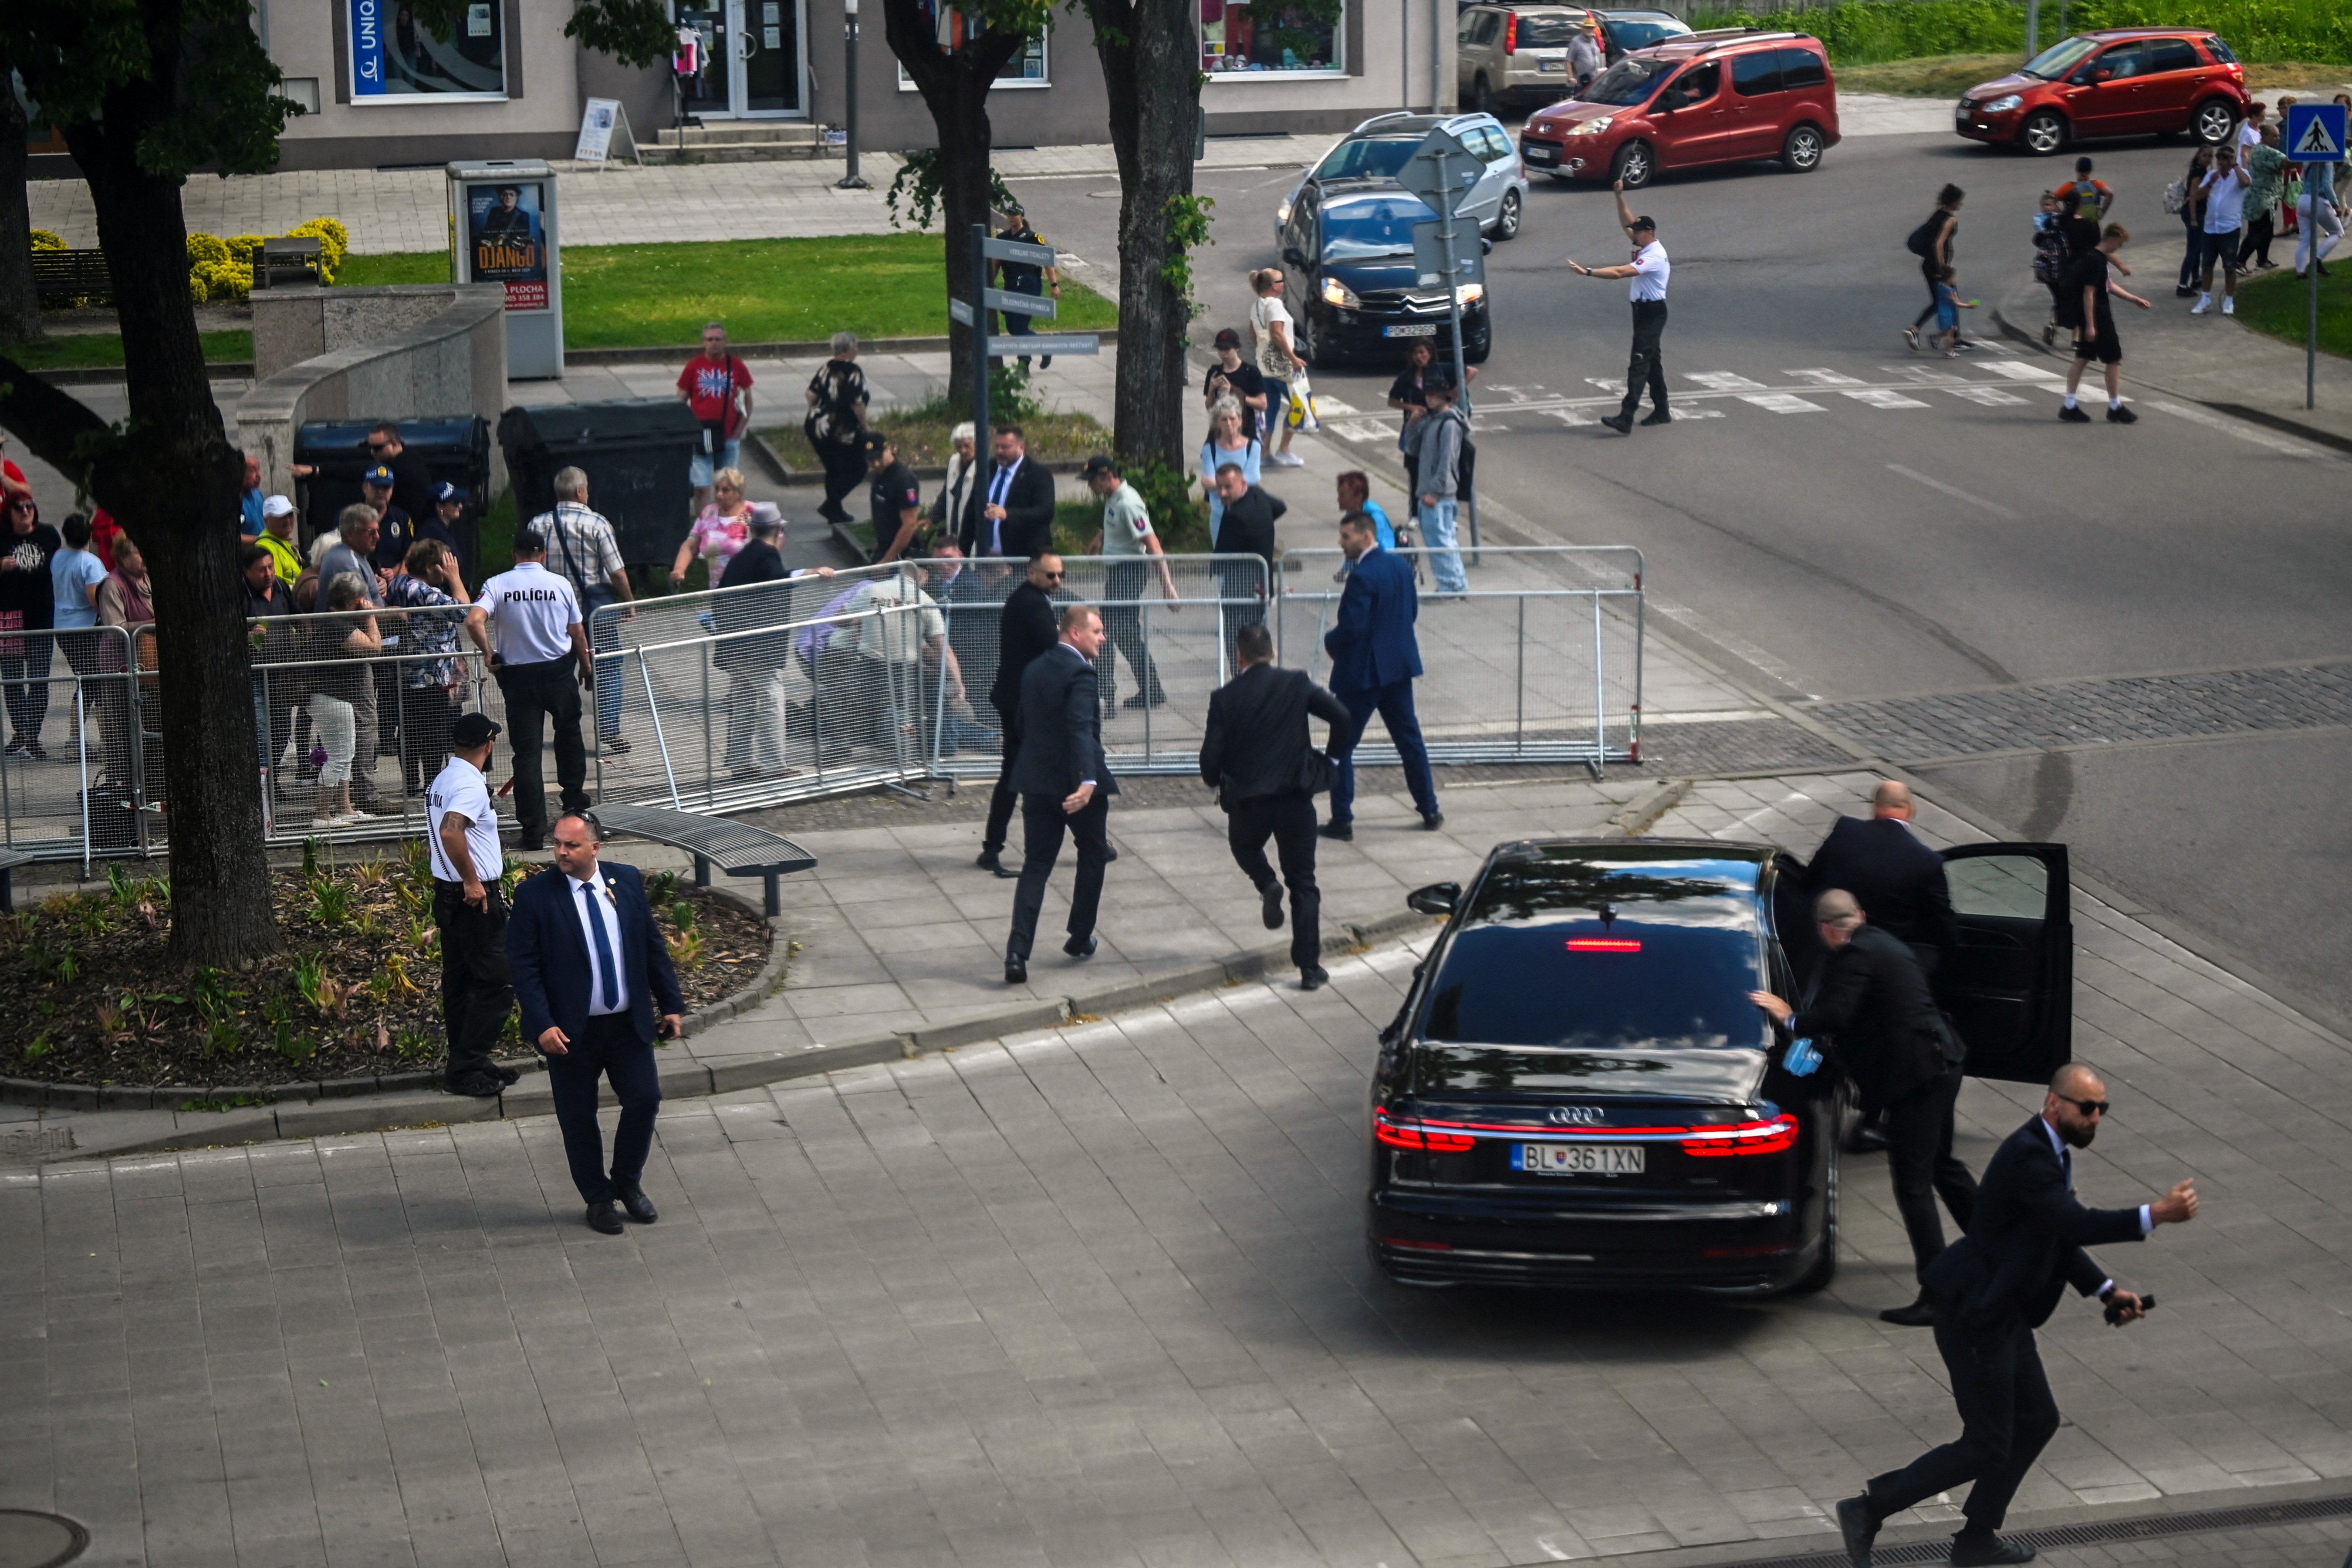
Wider ImageThe Slovak assassination attempt photo that nearly got away
It’s every amateur photographer’s nightmare: you spy a once-in-a-lifetime picture, and you forget to change your camera settings. But it can happen to a seasoned professional, too.